Twitter vs. Facebook
Twitter’s initial public offering (IPO) is approaching, and Twitter just raised its price range to $23-$25, suggesting it’s feeling optimistic about the outcome. Investors may be a little more nervous though. According to polls, just 35% of Americans think buying Twitter stock is a good idea, whereas 51% of Americans thought Facebook stock was a good idea before its IPO last May.
As for me, I’m not planning to buy any Twitter stock. I’ve always said that Facebook makes a weak showing when it comes to ad performance for direct response marketing (lead generation), especially compared to comparable offerings from Google. But what about Facebook vs. Twitter? The fact is, Facebook ads have improved a great deal since the IPO last year, but Twitter still needs a lot of work as an advertising platform.
I dug into some data to find out if Twitter ads actually work and how they measure up to Facebook. I compared the two social networks in four categories:
- Network Reach – Which platform reaches the largest audience?
- Ad Performance – Do Facebook and Twitter ads drive real results?
- Mobile Ad Performance – Which social network owns the mobile space?
- Ad Formats – Who offers the most varied and effective ad types?
What I found is that Facebook is doing OK, but not great by any means – see one Forrester analyst’s recent open letter to Mark Zuckerberg, pointing out that Facebook comes dead last on a satisfaction index of digital marketing channels. Still, in terms of key numbers like Revenue per Visitor, Facebook is beating Twitter.
Let’s look at the data in more detail.
RELATED: 45 Facebook Advertising Tips
Twitter Vs. Facebook: Network Reach
Facebook gets an A+ for network reach, with 1.15 billion active users that share 4.75 billion items daily.
Twitter has decent reach, but not nearly as large, with 232 million active users posting 500 million tweets a day.
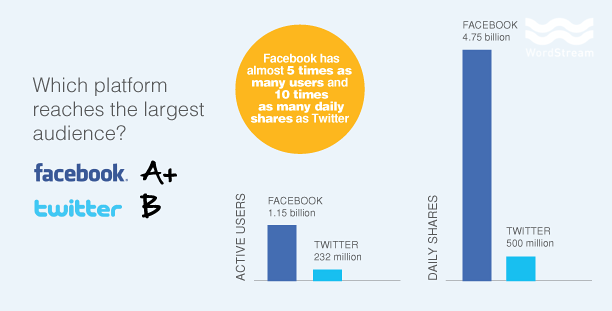
According to the Wall Street Journal, that’s just not enough of an audience for some advertisers. This much smaller reach is probably why Twitter claims just 13% of social media advertising budgets compared to 57% for Facebook.
Twitter Vs. Facebook: Ad Performance
It’s difficult to make an exact apples-to-apples comparison of ad performance on Twitter versus Facebook, because Twitter doesn’t release all the same metrics. But here’s what we do know:
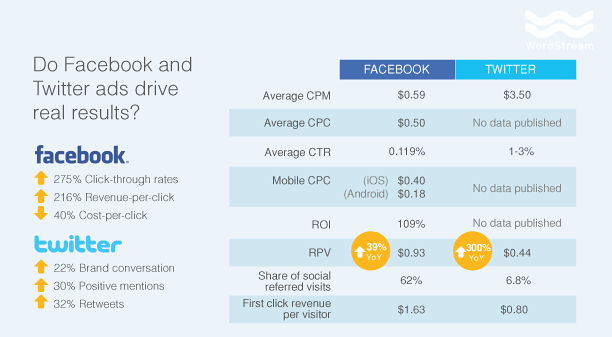
According to AdWeek, “engagement rates” for Twitter ads can be as high as 1-3%, much higher than Facebook’s average CTR of 0.119%. The benefit for Twitter is that its ads are in-stream, rather than pushed off to the side. However, average CPM (cost per impression) is significantly higher on Twitter, at up to $3.50 compared to an average CPM of $0.59 on Facebook, and Twitter does not release stats on ROI (109% for Facebook).
One exact comparison is revenue per visitor (RPV): $0.93 for Facebook compared to $0.44 for Twitter. Facebook’s RPV is double that of Twitter’s, but note that Twitter’s RPV is up 300% year over year, while Facebook’s RPV has only improved by 39% YoY. (Facebook’s first click revenue per visitor is also double that of Twitter: $1.63 and $0.82, respectively.) Further, share of social referred visits is down for Facebook (at 62%, down 20% YoY), while Twitter’s share of social visits is just 6.8%, but growing fast, up 258% year over year).
Some further considerations:
- Twitter claims that Promoted Trends provide a 22% lift in brand conversion, 30% lift in positive mentions and 32% lift in retweets. These promoted trends can cost more than $200,000 a day, 33% more than they cost in 2012.
- Facebook ad marketing performance varies greatly by vertical. For example, average CPC for alcohol brand ads is 45% higher than average. Gaming ads, on the other hand, have 30% higher CTR than average and 40% lower cost per click. (PDF)
- An AdAge survey ranked five online advertising platforms in terms of importance by ROI. Google was the clear winner, followed by Facebook, and then Twitter.
By my estimation, Twitter still has a lot to prove, maybe even more than Facebook.
Twitter Vs. Facebook: Mobile Ad Performance
In some ways, Twitter has the advantage here – on smaller mobile screens, it’s even more important for ads to be well-designed and feel organic. Because Twitter ads show up in the timeline instead of off to the side, they’re in a better position to dominate on mobile. Facebook ads, on the other hand, are in the right rail, which doesn’t even exist on the Facebook mobile app. As such, Facebook is failing its mobile advertisers.
Note, also, that Facebook only has one native ad format in the Facebook app, the App Promotion Ad. All Twitter ads show up both on desktop and mobile.
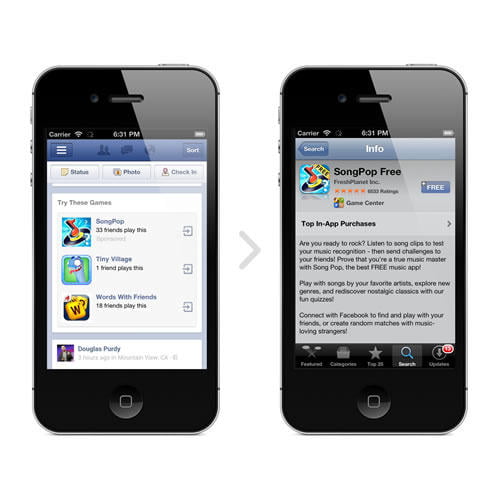
Here’s how the two networks are doing in terms of mobile performance metrics:
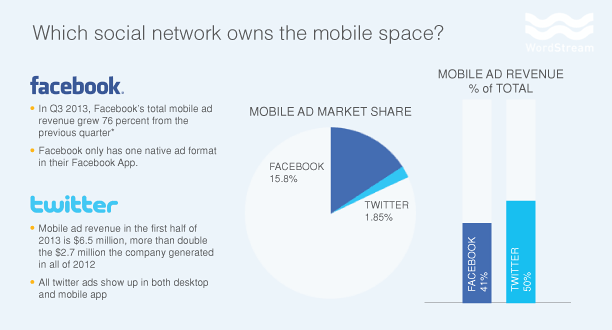
While Facebook currently leads in mobile market share, expect big growth from Twitter in this area. By 2015, Twitter is expected to net $1.33 billion in worldwide ad revenue, and more than 60% of that will be from mobile ads.
Twitter Vs. Facebook: Ad Formats
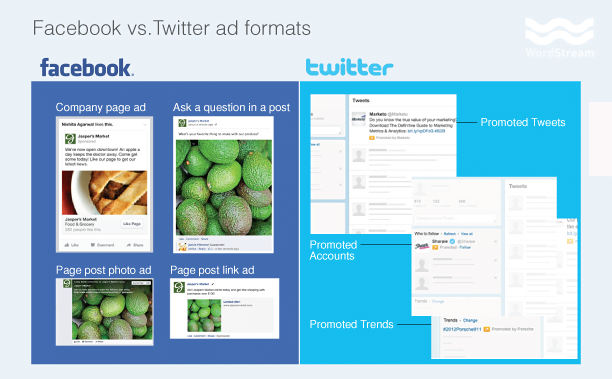
In June, Facebook cut its ad format options in half, in response to requests to simplify the system and eliminate redundancies. Facebook’s ad formats now include:
- App ads
- Domain ads
- Mobile app ads
- Offer ads
- Page-like ads
- Page post link ads
- Page post photo ads
- Page post text ads
- Page post video ads
- Sponsored stories
According to Robert Hof at Forbes, “rather than having to plan their campaign around which of 27 ad formats to use, advertisers instead will make choices on what they want to accomplish–such as amassing fans, getting people to install their app, or driving people to physical stores–and Facebook’s ad system will suggest the right kinds of ads to run.” My take is a little more cynical – in my view Facebook basically admitted that more than half of its ad formats didn’t work. This is generally not a great sign.
Twitter’s ad format offerings are much simpler:
- Promoted tweets
- Promoted accounts
- Promoted trends
My guess is they will introduce more ad options in the next year or so. Historically Twitter is slower to release new features than, say, a Google. (Not that the recent shift to include images in timelines is probably meant to increase ad clicks.)
Everyone seems to agree that both Twitter and Facebook are lacking when it comes to tracking, measurement, and analytics.
Conclusion: No Big Winners Here
In summary: Neither Twitter or Facebook is a great advertising option for direct response (lead generation) marketing. The intent on social just isn’t there compared to search. These social platforms are better for big brand advertising and engaging with your fans through content marketing (soft sells vs. e-commerce). If you have the budget for those kinds of marketing activities, then you’re better off on Facebook than Twitter, but the reality is, neither is all that effective and both platforms have a ton of work to do on the paid side. I suggest they look to Google AdWords and the Google Display Network for inspiration.


