Digital Benchmarks by Industry: PPC
Pay per click advertising is one of the most effective ways to get in front of prospective customers. But what types of results can you expect from your PPC campaigns? And how do those results compare to others in your industry?
Each year, we analyze thousands of Google Ads and Microsoft Ads campaigns to bring you our PPC benchmarks. These benchmarks provide the average click-through rate, cost per click, conversion rate, and cost per lead for over 20 industries to help you analyze your performance and compare it to competitors in your industry.
Read on for a summary of the last seven years’ worth of data. Or if you want a deep dive into this year’s benchmarks, check it out here >> 2026 Google Ads Industry Benchmarks With Trends & Tips to Adapt!
Contents
- 2026 PPC benchmarks
- 2025 PPC benchmarks
- 2024 PPC benchmarks
- 2023 PPC benchmarks
- 2022 PPC benchmarks
- 2021 PPC benchmarks
- 2020 PPC benchmarks
- PPC benchmarks FAQs
2026 PPC benchmarks
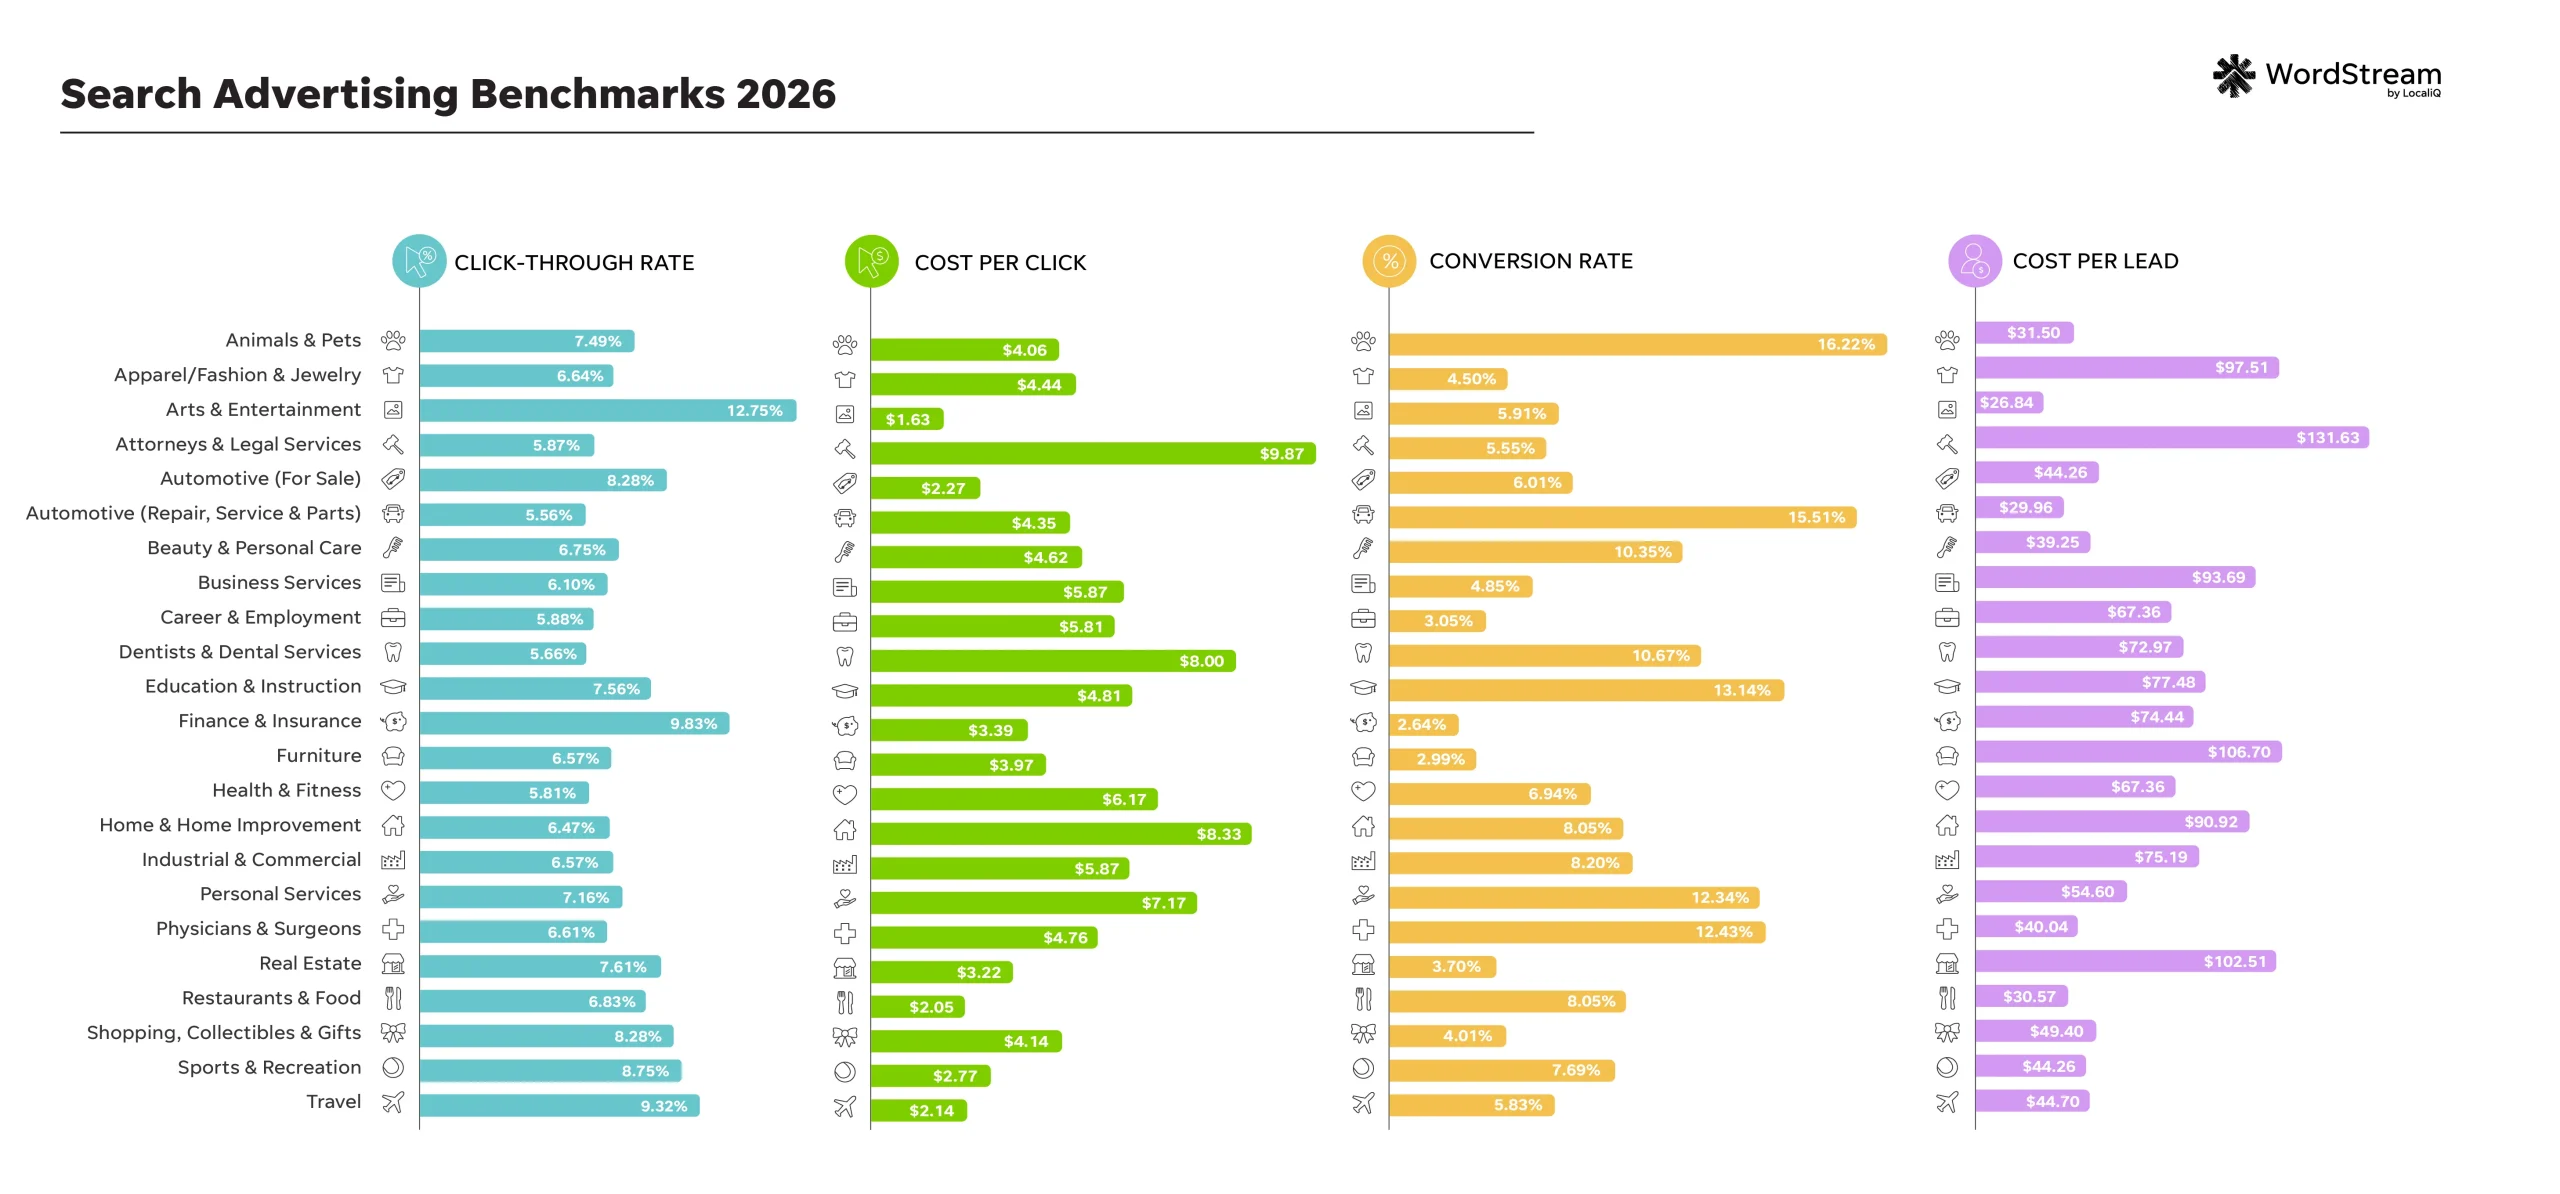
For our 2026 PPC benchmarks, we analyzed over 13,000 US-based campaigns running from April 2025 through March 2026. Here are the overall averages:
- Average click-through rate: 6.64%
- Average cost per click: $5.42
- Average conversion rate: 8.18%
- Average cost per lead: $66.69
Here are the 2026 search advertising benchmarks by industry:
🚨 Download the full report for a complete look at the data, expert insights, and more to make your Google Ads successful.
2025 PPC benchmarks
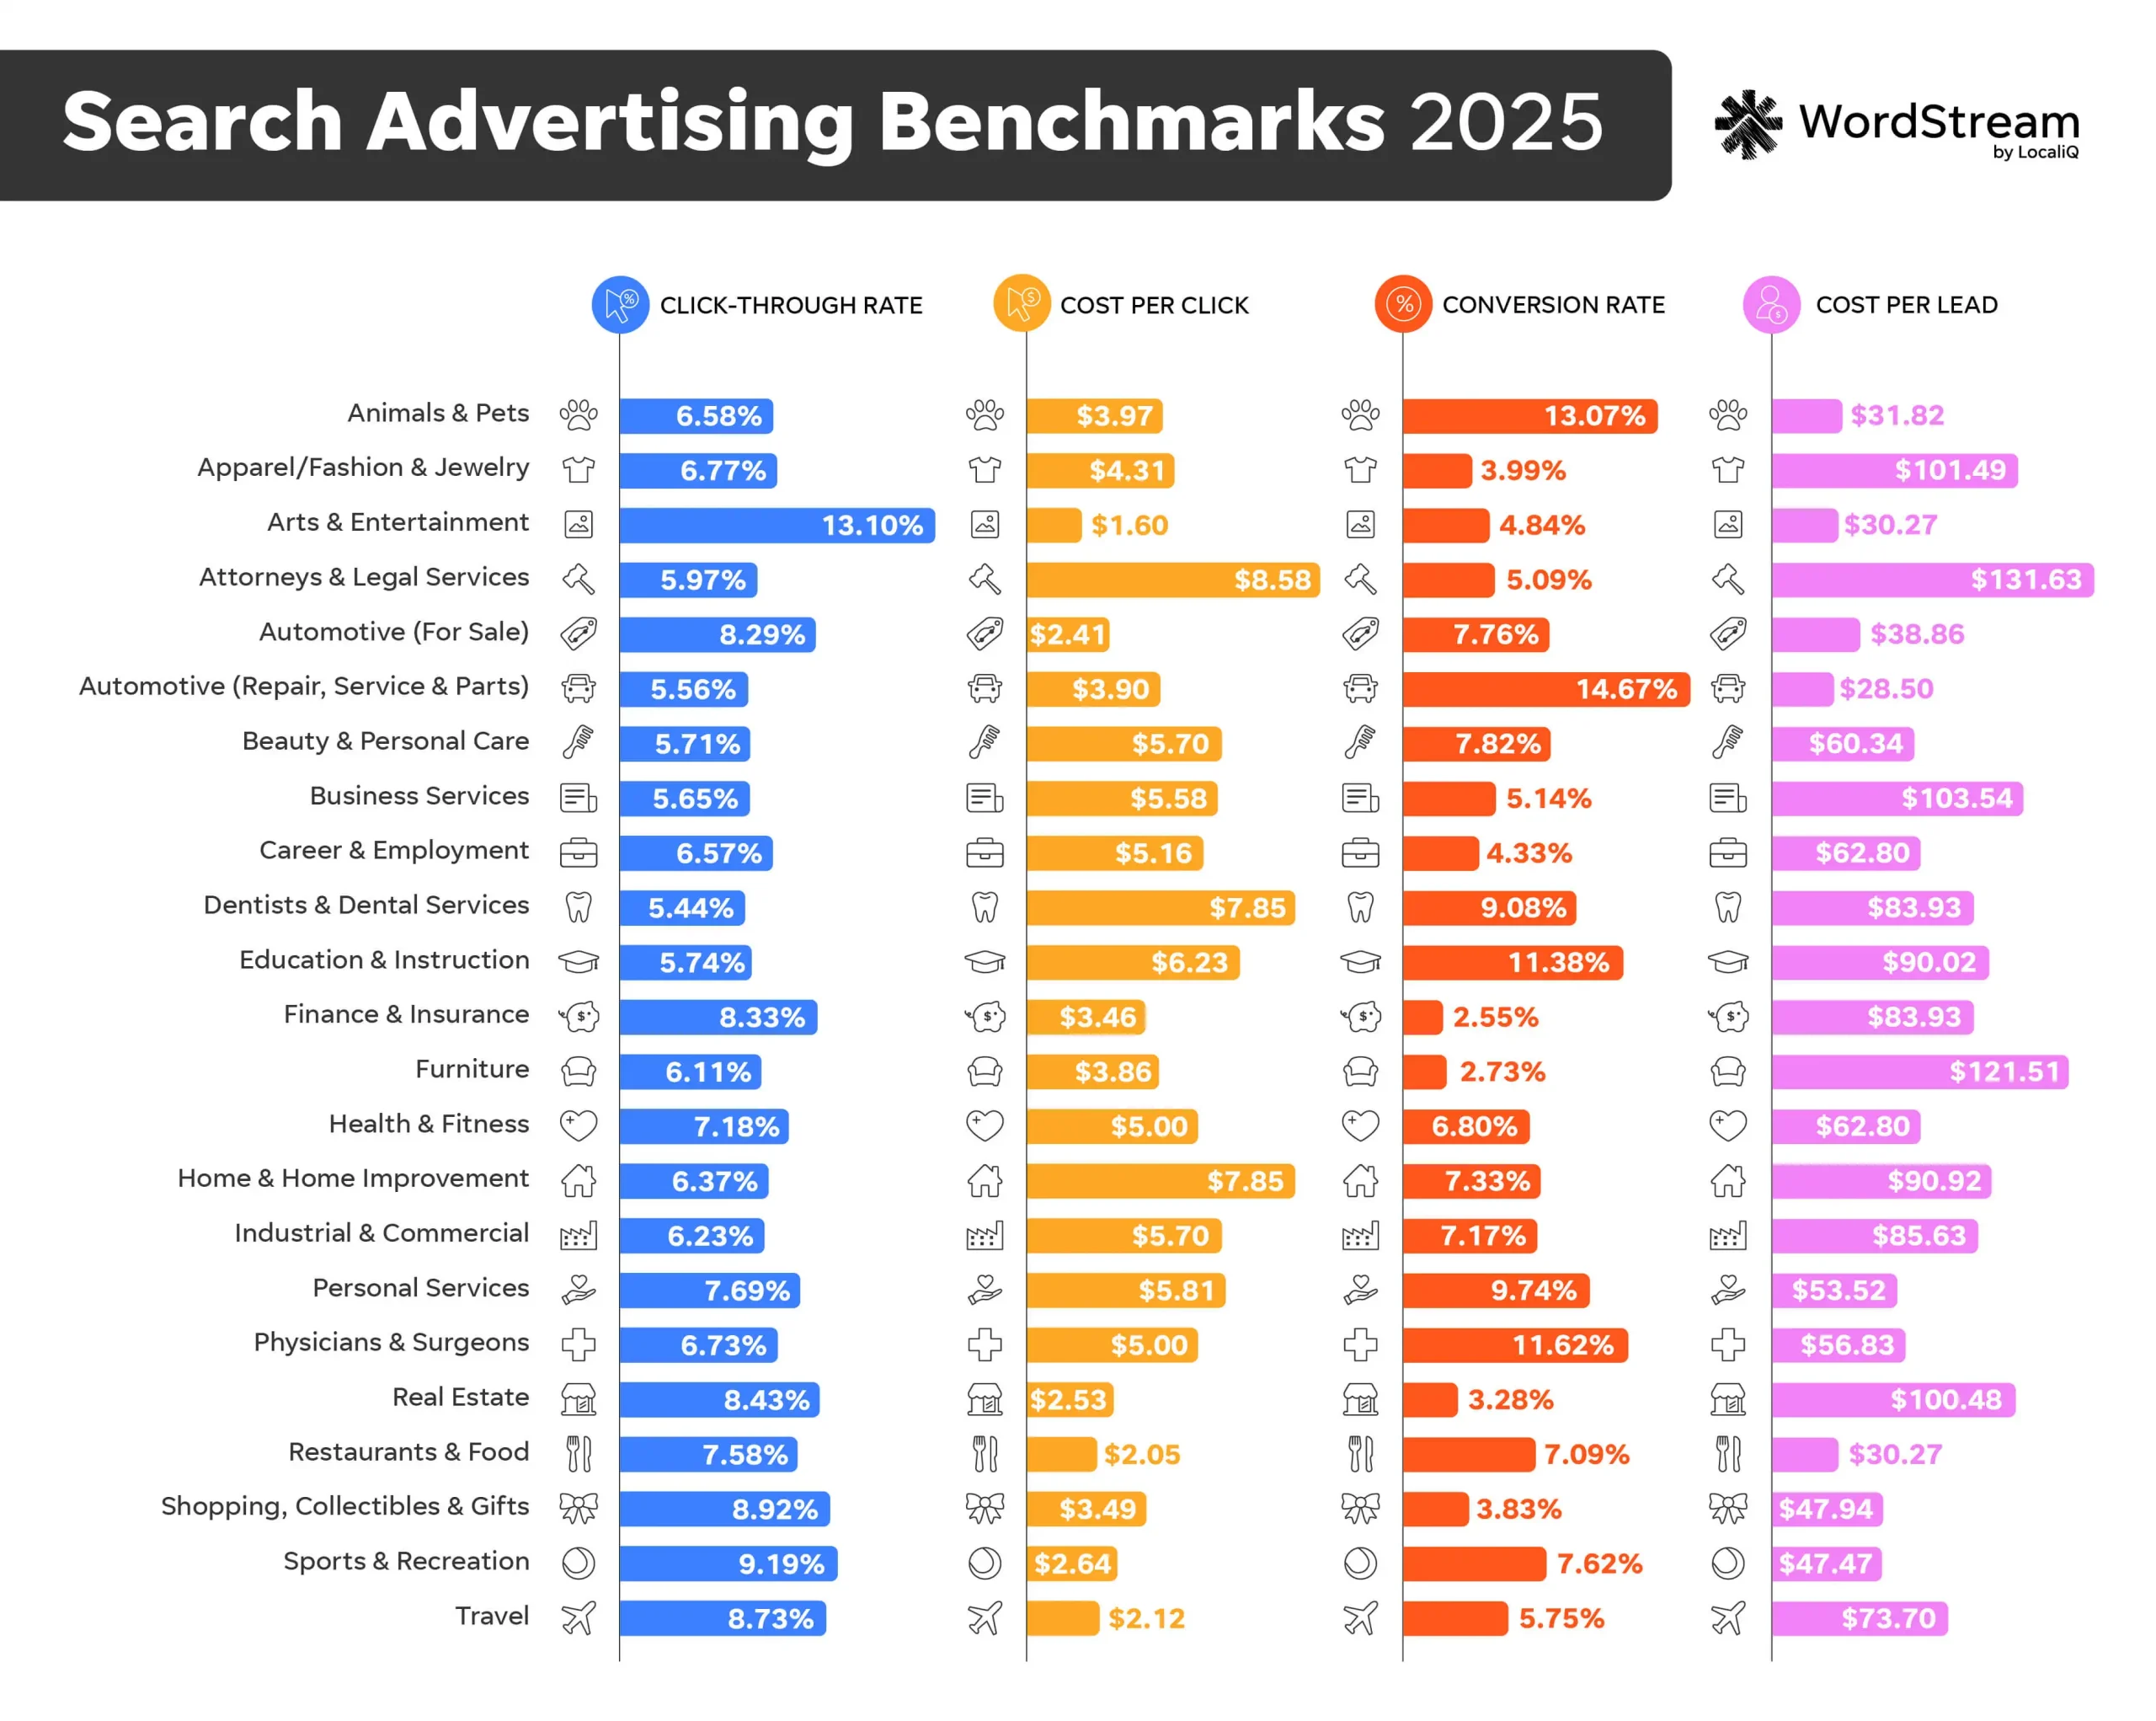
For our 2025 PPC benchmarks, we analyzed over 16,000 US-based campaigns running from April 2024 through March 2025. Here are the overall averages:
- Average click-through rate: 6.66%
- Average cost per click: $5.26
- Average conversion rate: 7.52%
- Average cost per lead: $70.11
See the 2025 digital benchmarks by industry here:
2024 PPC benchmarks
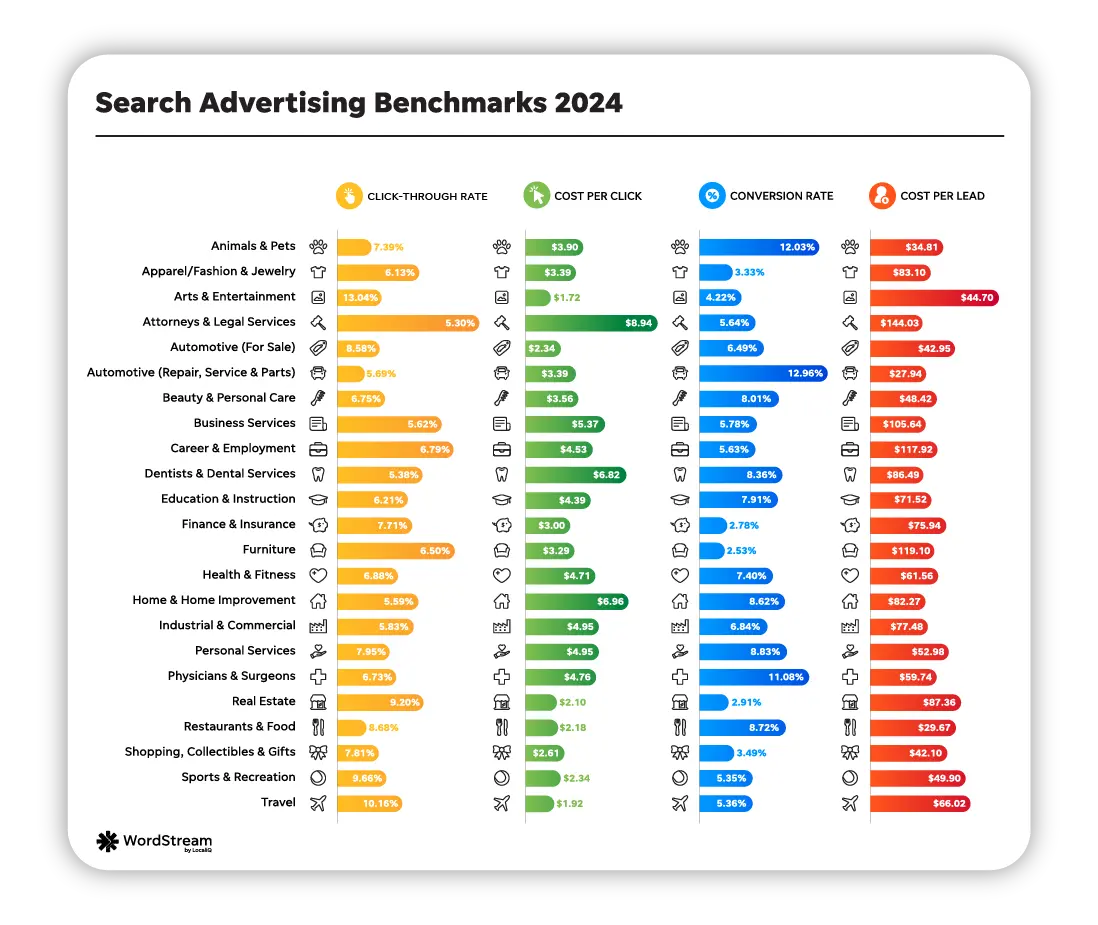
For our 2024 PPC benchmarks, we analyzed over 17,000 US-based campaigns running from April 2023 through March 2024. Here are the overall averages:
- Click-through rate: 6.42%
- Cost per click: $4.66
- Conversion rate: 6.96%
- Cost per lead: $66.69
See the 2024 digital benchmarks by industry here:
2023 PPC benchmarks
For our 2023 digital advertising benchmarks, we analyzed 17,253 US-based search advertising campaigns running between April 1, 2022, and March 31, 2023. Here are the overall averages:
- Click-through rate: 6.11%
- Cost per click: $4.22
- Conversion rate: 7.04%
- Cost per lead: $53.52
Here’s a breakdown of the 2023 PPC benchmarks by industry:

🛑 Worried you’re wasting spend in Google Ads? Find out with a free, instant audit >> Google Ads Performance Grader
2022 PPC benchmarks
For our 2022 PPC benchmarks, we analyzed 18,228 North American-based client campaigns between Dec 17, 2020, and Feb 17, 2022.
Here’s a breakdown of the 2022 digital benchmarks by industry:

Brought to you by
![]()
Ready to grow your business?
Unlock the results you’re looking for with technology-backed solutions designed for small businesses and agencies.
2021 PPC benchmarks
For our 2021 PPC benchmarks, we analyzed 18,316 North American-based customer campaigns running digital advertising across all search engines between May 1, 2020, and June 25, 2021. Here are the overall averages:
- Click-through rate: 6.18%
- Cost per click: $3.53
- Conversion rate: 8.82%
- Cost per lead: $41.40
See a breakdown for every industry by metric here.

2020 PPC benchmarks
For our 2020 PPC benchmarks, we analyzed 15,759 US-based customer accounts advertising on Google Ads and Microsoft Advertising between March 16 and May 31, 2020. This was during the onset of the COVID-19 pandemic. Here are the overall averages for Google Ads campaigns:
- Click-through rate: 5.90%
- Cost per click: $2.76
- Conversion rate: 5.63%
- Cost per lead: $51.50
See a breakdown for every industry by metric here.

PPC benchmarks frequently asked questions
Have questions about these benchmarks, PPC, and more? We’ve got you covered!
What is PPC?
Pay-per-click, or PPC, involves advertising on search engines like Google and Bing. Businesses create ads that target keywords (the terms their potential customers are typing into search), the ads appear at the top of search engine results pages for those searches, and they only pay when someone clicks on their ad.
💡 Want to learn more? Download our free guide >> PPC 101!
How much does Google Ads cost?
The cost of Google Ads depends on several factors, including how well you manage your account, the types of keywords you’re targeting, your customer lifecycle, and consumer trends. The biggest factor, however, is your industry. The benchmarks on this page will give you a feel for Google Ads pricing, but for a deeper dive, head to our post >> How Much Does Google Ads Cost?
What is cost per click?
Cost per click (CPC) is the actual price you pay for each click in your PPC campaigns. Cost per click is not a fixed price for any one ad or advertiser. It is determined by a formula that factors in your bid, the quality of your ad, and the position of the ad on the page. Learn about how Google Ads determines cost per click here.
What is conversion rate?
Conversion rate (CVR) is the percentage of people who clicked on your ad and then also completed the conversion—where a conversion could mean filling out a form, making a purchase, downloading an app, etc.
What is cost per lead?
Cost per lead (CPL), also known as cost per conversion, cost per action, or cost per acquisition, is how much it costs for you to obtain a conversion. A conversion is defined by the action you want your ad viewer to take, such as to fill out a form or make a purchase. Unless everyone who clicks on your ad converts, this cost is nearly always higher than your cost per click.
What is click-through rate?
Click-through rate (CTR) is the percentage of people who view your ad (impressions) who then actually go on to click the ad (clicks). Higher click-through rates mean your ad is relevant to your audience.
How can I improve my ad performance?
If you’re already running Google or Microsoft Ads and find that your metrics are falling below industry averages, these resources can help:
- The WordStream blog (in particular, the Paid Search Marketing category).
- The in-depth, visual (and free!) guides in our Resource Center.
- This post on 10 Questions to Ask When Choosing a PPC Agency.
- You can also book a free digital marketing assessment with one of our digital marketing experts if you’re interested in partnering with us!
Where can I learn more about search advertising?
- If you’re just learning the ropes of online advertising, WordStream’s PPC University is a great place to start.
- If you’re ready to get started, head over to our Step-by-Step Guide to Your First Google Ads Campaign.
- For more options, refer to our list of The 10 Best Google Ads Training Courses for All Levels.
Looking for more help or want to see how we can run your PPC campaigns for you? Reach out for a demo.