The time has come. Google Analytics 4 (GA4) is here and ready for action. Actually, GA4 is here and ready for takeover.

As you may have heard, the current Google Analytics platform, Universal Analytics (UA), will no longer collect data as of July 2023. At that time, your only option will be to make the switch to GA4.
But why? Why is this necessary? And how will it affect your business? Read on to learn the history of Google Analytics, the differences between UA and GA4, plus plenty of pros and cons, tips and tricks to help you navigate this change.
Table of contents
- History of Google Analytics
- UA vs GA4: Privacy & data collection
- UA vs GA4: Reports
- New features in GA4
History of Google Analytics
For the SEO nerds out there, here’s the timeline from Urchin in 2005 to Google Analytics 4 in 2020.
2005: Google acquires a platform called Urchin. Urchin was used to “beautify” log files and make them more palatable at a time when log files were our only source of data.

2006: Google redesigns the platform and brands it as Google Analytics.
2012: Google Analytics is discontinued and replaced by Universal Analytics. Universal Analytics allows users to track cross-platform, device-specific tracking, and create custom dimensions and metrics. This was necessary as apps and mobile browsing were becoming increasingly popular and brands needed a way to optimize for it.

2018: Europe rolls out data privacy and security laws referred to as General Data Protection Regulation (GDPR). These laws protect citizens of Europe not only in Europe but also on any site they browse regardless of the country the site is hosted in.
(I would like to make a disclaimer that I am not a privacy expert and that all businesses should consult a privacy expert and lawyer to ensure they are in compliance with applicable laws)
The data standards set in GDPR actually lead to Google Analytics being deemed illegal in France and put millions of businesses at risk of being fined for using the platform. Not long after, New Zealand, Japan, Brazil, California, and many other countries/territories roll out their own privacy laws. With more legislation passing, Google has to make a change in how it collects, stores, and moves its data.
October 2020: Due to the increasing concerns around privacy and security, Google rolls out Google Analytics 4. GA4 has many baked-in features and tools to allow more control over your data. Google has gone as far as to say that GA4 was built for privacy.

March 2022: Google announces that as of July 1, 2023 Universal Analytics will stop collecting new data—meaning you will have to switch to GA4.
NOTE: Even though this switch isn’t happening for another year, it’s important to note that your data will not migrate over from UA to GA4. So if you want to have a year’s worth of historical data, your best bet is to switch to GA4 now
To learn more, check our blog post covering the announcement.
So what are the differences between GA4 and UA? There are many. Let’s look at them piece-by-piece.
UA vs GA4: Data collection & privacy
First and foremost, here are the differences between UA and GA4 with regard to user data and data sources.
Privacy
- No IP addresses. The most notable change in GA4 is that IP addresses are no longer collected or stored. In Universal Analytics, you were able to see IP addresses unless you physically went in and anonymized them. This is the first of many changes made to protect user data.
- Easier data deletion which allows admins to delete data at the request of any user(s).
- Data retention options allow you to choose how long GA4 can store user-specific data. By default, the time period is two months, however, you extend it to 14 months if desired. (It should be noted that this doesn’t mean you will only have access to data for 14 months, it just means you lose user-specific data after 14 months.)
- Options to turn off location-specific data and ad personalization data by country.

Data Streams for the new omnichannel landscape
The data collection differences aren’t only useful for data privacy and security reasons, but they’re also helpful for better understanding the full user journey.
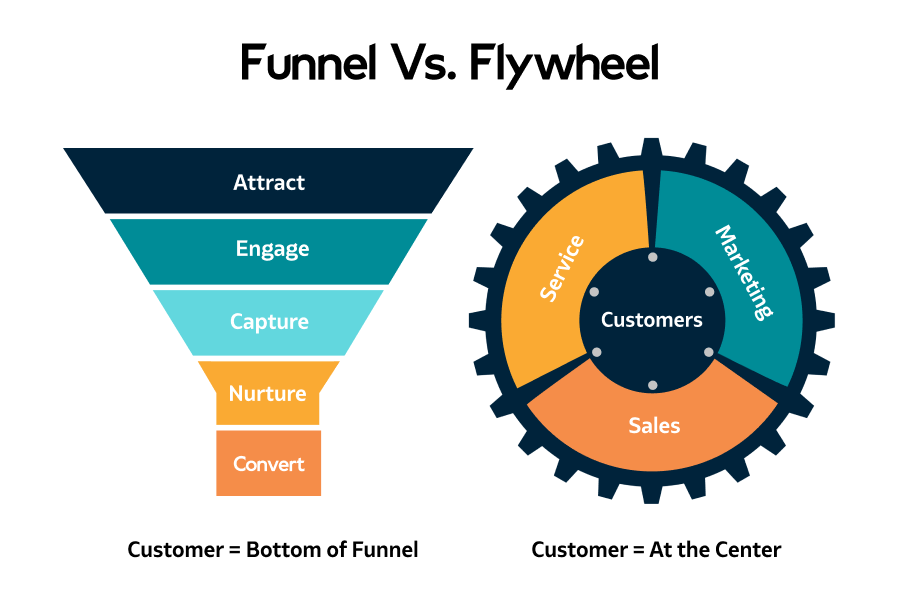
Universal was rolled out in 2012. At this time 45% of people had smartphones, there were 540,000 apps in the App Store, and there was $225.5 billion spent on e-commerce. We were also still teaching a traditional marketing funnel of awareness, interest, desire, and action. This funnel focused solely on the acquisition of new customers and didn’t really address retention at all.
In comparison, at the beginning of 2021, 85% of people had smartphones, there were 4.5 million apps in the App Store and $578.50 billion was spent on e-commerce in 2019. Oh, and there are very few “mobile websites” left as Google had already rolled out mobile-first indexing.
With all of these changes, we saw the introduction of the marketing flywheel. This flywheel puts more emphasis on retention and turning customers into promoters (more on this in our post on growth marketing).
One of the first ways GA4 addresses the new user journey is through the use of Data Streams.
Data Streams are the source that gathers information and sends it to your Google Analytics property. In GA4, you can have multiple data streams per property. This means if you have two websites, or if you have a website and an app, you can see how your users interact with your properties all in one place.
UA vs GA4: Data & reports
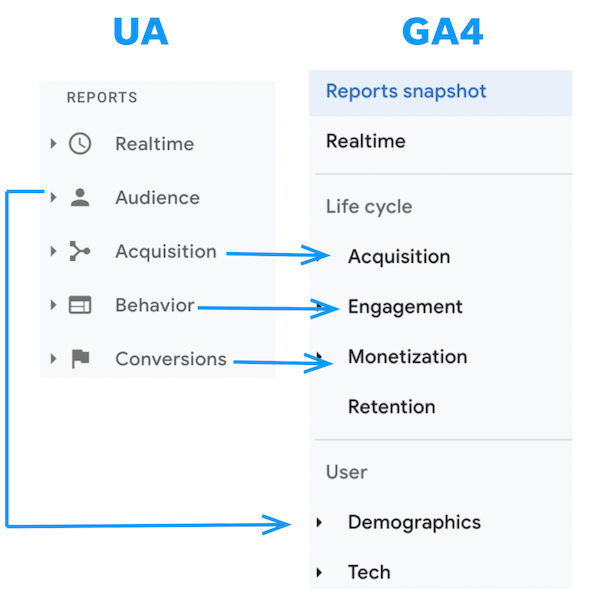
When you compare the information available in Universal Analytics and Google Analytics 4, not too much has really changed. It may look like GA4 has more information on users, but UA has the same information, it’s just tucked under the “Audience” tab.
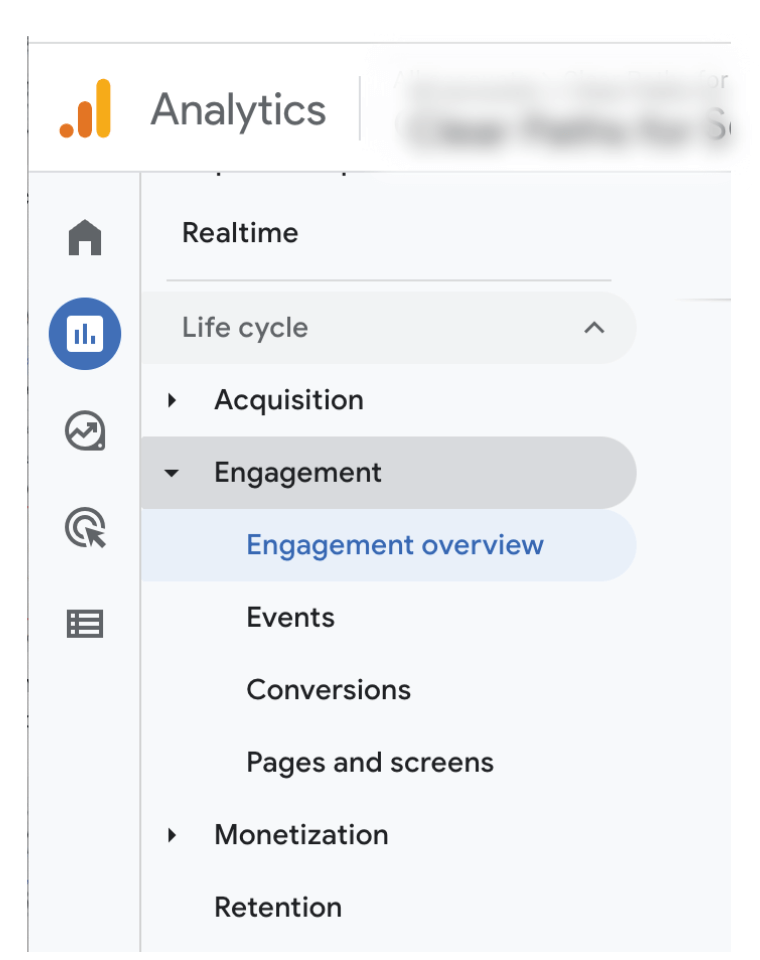
The biggest difference here is in language around “engagement” and “monetization” as well as the addition of “retention.”
- Engagement has replaced behavior, but covers many of the same things with added reports on conversions (previously known as “goals”).
- Monetization, on the other hand, is a new beast that we will tackle later on in this article.
Now, like we touched on earlier, there has been an increase in interest to keep customers and turn them into advocates over the last 10 years. Google has put retention reports blatantly in the Life Cycle report to reflect its importance. Though this section of GA4 is currently sparse, I can imagine we will see updates in the coming years.
Users vs traffic
As you may know, a user is a person that comes to your site. If they come through their phone one time and their computer three times, they are still the same user. Traffic, on the other hand, refers to sessions.
In GA4, user acquisition and traffic acquisition has been split into two different reports.
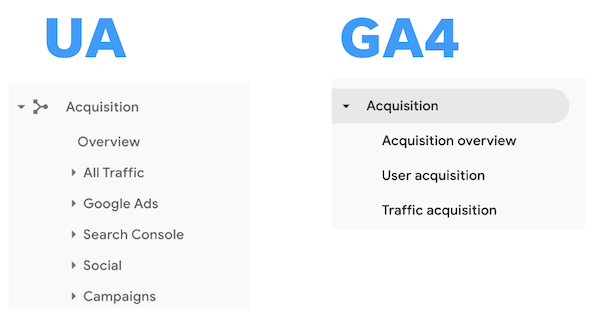
This has resulted in separate acquisition dimensions for both users and sessions, so be sure to be aware of which one you select when creating reports.
Behavior vs engagement metrics
In Universal Analytics, behavior metrics were included in almost every report. These metrics included bounce rate, pages/session, and average session duration.
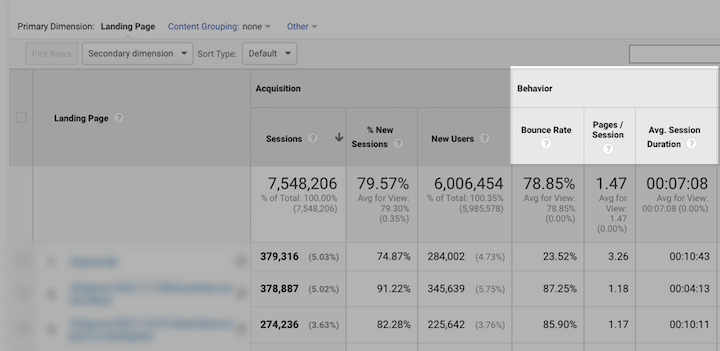
Google Analytics 4 replaced these metrics with new “engagement” metrics. These new metrics are based on “engaged sessions,” which Google has so kindly defined as: Sessions that lasted longer than 10 seconds, or had a conversion event, or had two or more screen or pageviews.
The metrics include:
- Engaged sessions
- Engagement rate
- Engaged sessions per user
- Average engagement time
That’s right… No more bounce rate!
>> July update: Bounce rate has been added back in, along with conversion rate and UTM parameters!
Monetization
Monetization reports have taken over the former home of “conversions” reports. The big thing to note here is that monetization in 2021 looked far different than monetization in 2012.

Traditionally speaking, monetization was limited to ecommerce in one way or another. Today though, monetization could include ad revenue, in-app sales, or ecommerce. In GA4, monetization reports take all streams of revenue into account.
On the downside, if you don’t track anything of direct monetary value on your site, this entire section of GA4 is useless.
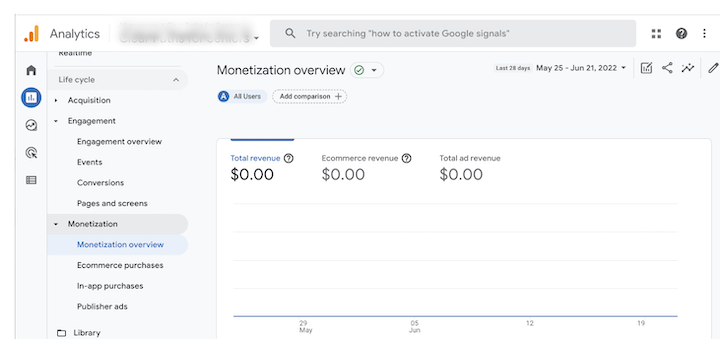
This is a bummer because in UA, conversion reports weren’t solely focused on money. They also considered the non-monetary conversions and the attribution behind those conversions.
Session-based data vs event-based data
Universal Analytics collected session-based data. Each session was made up of different “hit types.” These hit types included page hits, ecommerce hits, social interaction hits, etc. In contrast, GA4 is an event-based platform, meaning everything is considered an event. First visit? Event. Pageview? Event. The list goes on.
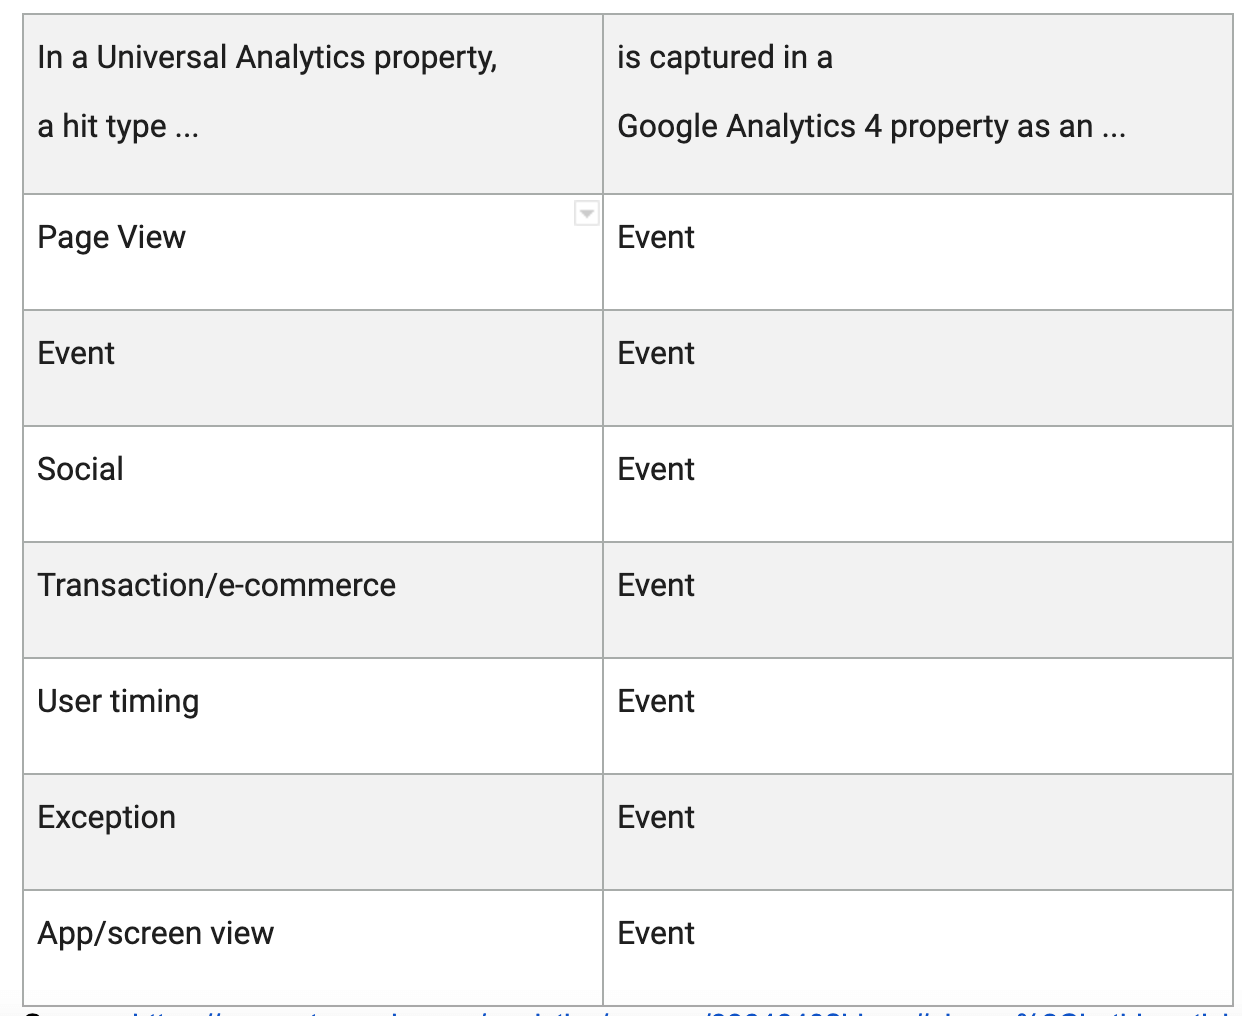
Now this change is great because it gives us more information on how people use our properties. The downside is that it also means that the two datasets (UA & GA4) don’t play well together…
And that’s why you start from zero when switching from UA to GA4.

Event & conversion creation
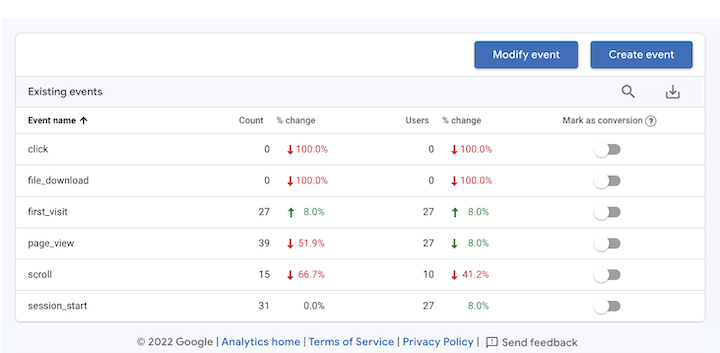
Not only are events treated differently, but they are also passed through to GA differently as well. As you can see in the diagram above, gone are the days of action, category, and label. In GA4, we have parameters, enhanced measurement, and in-platform event creation.
When you set up your Data Stream you will have the option to turn on enhanced measurement which collects page views, downloads, outbound clicks, video engagement, and scrolls. If you keep enhanced measurement on, all of these events will be collected automatically! No extra work necessary.
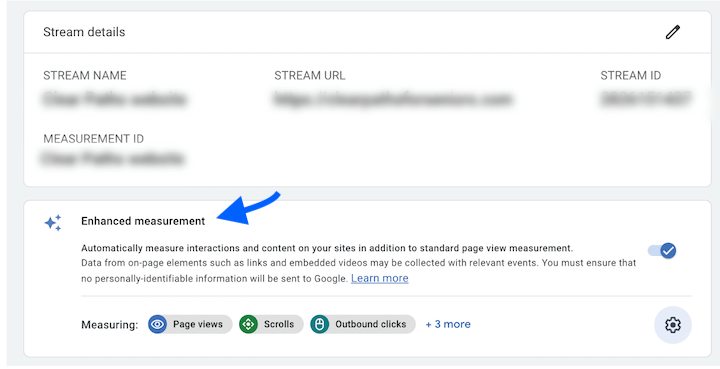
If there is an event that you’d like collected but doesn’t fall under enhanced measurement, you may be able to set it up right in the GA4 platform using conditions and parameters. Parameters are pieces of information sent alongside events that provide context on the user or user action.
Once you’re collecting an event, you have the option to mark it as a conversion by simply clicking a toggle button—no more “Goal” setup!
Increased functionality in Google Analytics 4
During your initial setup, you will want to ensure you tackle all of the options available to you in the “property” settings. We’ve already covered many of them, but I highly recommend checking them all out.
Product Links
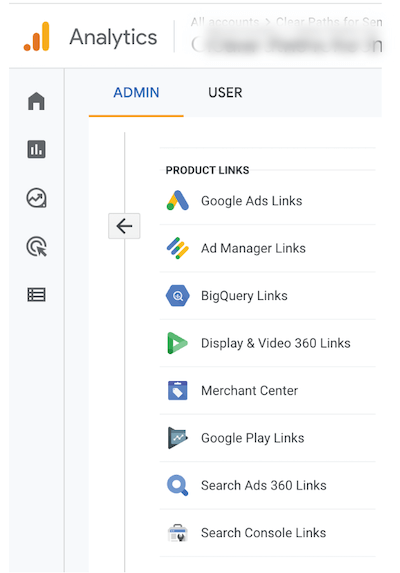
One of the last options under property settings is Product Linking. It’s likely you’ve used Product Linking with Google products before, maybe through Search Console or Google Ads. Basically all it does is link data between different Google Products, there is no real difference with Product Linking in GA4 other than the platforms available.
In GA4 you now have the option to link to Google Merchant Center, Google Optimize, and BigQuery natively and for free!
Available customizations
Perhaps the most underrated feature of Google Analytics 4 is the ability to customize the platform to meet your needs.
Not only are you able to create custom reports in GA4 like you could in UA, but you can actually add those reports right to your navigation. That’s right, no more having to navigate to a separate part of the platform! In GA4, if you want to create a new report, you can put it anywhere in the Reports navigation.

Other customization options include changing the name of collections and topics in the secondary navigation using the Library(not to be confused with the Google Ads library).
Explorations
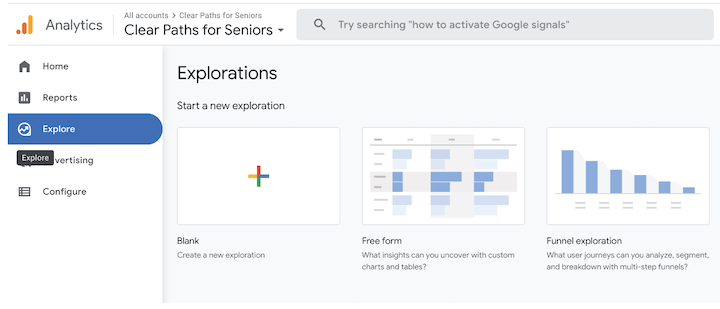
You can create dashboard-esque reports using the Explorations in GA4. I like to say that Exporations is the love-child of custom dashboards from Universal and user interface of Data Studio.
Machine learning capabilities
We started to see the roll out of machine learning tools with Universal Analytics. Insights were rolled out in 2018 to help people find trends and outliers in their data. As time went on, the machine learning got more sophisticated and allowed users to “ask questions” in the search bar as a way of quickly finding information.
When GA4 was released, insights were baked into the platform more than ever. Not only are insights available and highlighted throughout the platform, but new machine learning tools were also introduced!
Anomaly detection
Anomaly detection, which was previously reserved for insights, is now available on most line charts. This tool is extremely helpful for identifying statistical differences in your data at a glance. In order for anomaly detection to work, Google must have sufficient historical data to build predictive models. Which leads to the next new tool—predictive analytics!
Predictive analytics
Previously, if someone wanted to access predictive analytics, they would have to pay for another tool or create them themselves. But, no more! GA4 introduced predictive analytics for LTV, churn probability, likely churners, likely top spenders, likely purchases, purchase probability and more.
Attribution
For the last few years, Google has been working on its tools. With the rollout of Universal Analytics, it rolled out its multi-channel funnel tools. Then, in December of 2019, it rolled out its Attribution Project tool which allowed users to access a group of tools surrounding attribution and conversion.
Now in GA4, we see a section in the primary navigation called “Advertising,” Upon clicking into this section of GA4, we will find all of the same tools from the Attribution Projects. This includes conversion paths, time to conversion, the model comparison tool, and touchpoints to conversion.
But the tools aren’t the only attributions you’ll see in GA4. In the last few months, Google announced that all users were getting access to Google’s data-driven attribution model. Once that rolled out, all GA4 properties were changed to using that model as their default conversion model, whereas UA still relies on last-click.

Lots to learn
Here is the thing: We are just starting to really understand GA4. And much like every other Google product, it changes every day! There is still so much to learn and discover in GA4, and this process will look different for everyone.
I highly encourage you to get out there and play around in GA4. It may be uncomfortable, but I assure you it’s much more like UA than you think it is, just a bit more sophisticated. And who could be mad about that?

