It’s no secret that I LOVE paid advertising. I wish I could play with ads all day, every day. But, I can’t. No one can. That’s because they cost a pretty penny.
You don’t have to love PPC as much as I do. However, when running ads, you DO have to ensure all the money you’re putting towards them is bringing in a return.
And that is why PPC reporting is a must. But the world of PPC advertising is complex, so it can be hard to know the best way to report on your performance.

That’s why I’ve created this complete guide to fool-proof PPC reporting. I’m going to cover:
- PPC reporting goals
- What to include in a PPC report
- Tips and strategies for a great report
- PPC reporting pitfalls to avoid
- Helpful PPC reporting tools
By the end of this guide, you’ll be ready to build attractive, accurate, and actionable PPC reports that help your business to grow!
First, establish your PPC reporting goals
Before you create a PPC reporting process, you first want to identify what success might look like for your accounts. Measuring PPC data is hard to do when there aren’t goals set in place first!
We wish there was a “one size fits all” answer to what your PPC goals should be, but your PPC PPC reporting goals vary depending on the situation—whether you’re an agency managing a client’s account or a small business owner starting your account from the ground up. Here are some examples of PPC reporting goals:
- Provide an overview/executive report
- Prove ROI
- Showcase your work
- Track your progress
- Highlight trends
The best tip we can give to help you identify what your PPC goals look like to you is to ask yourself one key question: “What does success look like for my account?”
Getting down to the big picture “end goal” will help you to have a driving force, or a “north star,” to back all your PPC reporting efforts.
For some, this might mean just showing improvement on overall ROI. Meanwhile, other folks may need a way to showcase the progressive work they’ve done or highlight high level trends.
Understanding what you want to get out of your PPC reports will help you to frame up what type of report you need that will display that.

This report is simultaneously showcasing the work done while being goal-focused on conversions.
Essential elements to include in a PPC report
I like to think that PPC reports are like fingerprints: no two reports are the same. What you’ll want to include in your reports, and how in-depth you’ll want them to go, will of course depend on your unique goals.
That being said, I looked into PPC reporting strategies and found that Databox’s PPC reporting list was best. Here’s what it includes:
Date range: This is a good time to address that, along with your goals, your PPC reporting frequency will flex to meet your needs as well. Keep your date range consistent and always remember to mention that timeframe somewhere within the reports so viewers can apply further context to what they’re looking at.
Campaign goal: On top of date range, another way to apply context to the numbers being reported on is to remind yourself or your viewers the point behind each campaign being evaluated. For example, a display campaign looking to drive awareness with lots of impressions but no clicks may be a success—whereas a campaign with similar metrics looking to drive traffic or sales may not be considered quite as successful.
Conversions: Conversion tracking is a no-brainer different for everyone, since every ad has some type of meaningful action you want your visitors to take once they click or view it. Think of this as your “bread and butter” PPC reporting metric.
CPA: Cost per acquisition will help your PPC reporting prove whether or not you’re getting the “best bang for your buck.” Conversions are great, but if you’re not pulling them in at an efficient cost your overall advertising experience will suffer.
Note: Cost per acquisition (CPA) is not the same as customer acquisition cost (CAC). Learn more here.
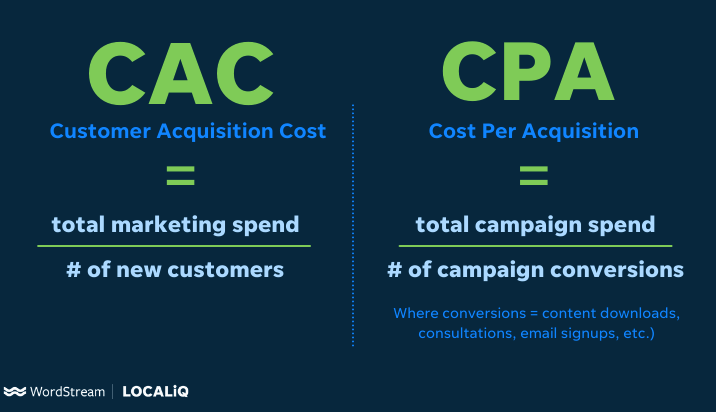
ROAS: Going hand-in-hand with CPA, ROAS takes PPC reporting to the next level by looking at overall ad spend in relation to your revenue. Favored by the ecommerce community, ROAS is another helpful metric that takes CPA beyond just individual cost per conversion by looking at overall spend versus revenue.
Ad targeting: Try breaking your campaigns out by ad group or ad set to display what audience segments you were trying to attract by keyword or audience targeting. That way you’ll know if that’s a successful segment to reuse in future.
CPC: If your PPC reporting ever shows that your ROAS or CPA is out of whack, the next place you’ll look is your cost per click (how to lower your CPC here!). This is great to include to identify any areas of wasted spend.
Speaking of wasted spend, our free Google Ads Performance Grader will identify leaks in your spending and tell you how to plug them. Try it now!
Ad CTR: Your ad click-through rate can provide even more context to your PPC reporting. In general, a high click through rate is what you want. If your ad CTR is low, you know your viewers see the ad but aren’t inclined to click on them. This uncovers a plethora of possible problems to fix like improving your ad copy, tweaking your segment, or switching up your strategy.
General traffic metrics: Including mentions of overall traffic, bounce rates, time on page, or any other general analytics metrics you think could be helpful. This will help you or your viewers decide whether your paid performance truly is good or bad in comparison to your overall marketing efforts.
KPI breakdown: This one is up to you. But if you’re showing these PPC reports to people who aren’t in the weeds of your accounts each day, odds are they might not be familiar with all the industry-specific terms. Quick bursts of text that define any jargon or provide a story behind the data will make your report reader-friendly.
Attribution models: This is a bit more advanced and, therefore, may not be applicable in every situation. But if you want a better idea of your typical customer journey, reporting on your attribution modeling will help viewers understand how each conversion or action is actually counted and where it comes from.
Month-over-month data: Or week over week, quarter-over-quarter, however you choose to keep yourself on track is fine—as long as you keep yourself on track! The point of including this type of historical data is to have something to compare to, and see where you’re improving or starting to slide before you snowball into a performance ditch.

PPC reporting tips for a great report
Aside from including the right kind of meat and potatoes to make your PPC reporting a healthy marketing meal, you may also want to consider these four tips when setting up your report:
1. Customize your columns
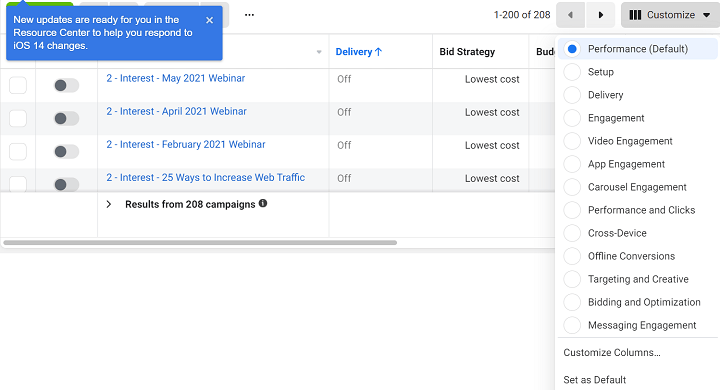
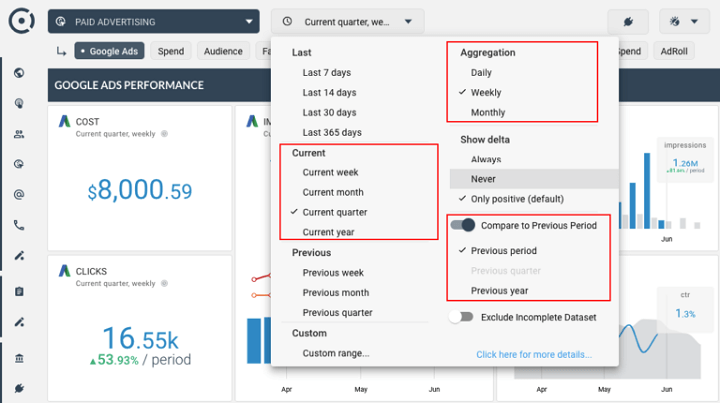
Custom columns within your ad accounts per platform will save you time later when reporting. When you’re in the accounts working on action items daily or weekly, you’ll be able to see your personalized column set with data specific to your reports.
That way, you can make educated decisions regarding changes to your account with your PPC reporting always in mind. It’s easy to set up by simply selecting the column icon and following the custom column choices from there. Whether you’re at the campaign level, ad set level, or any view in between, custom columns can be a PPC reporting time-saver.
2. Tell a story with your data
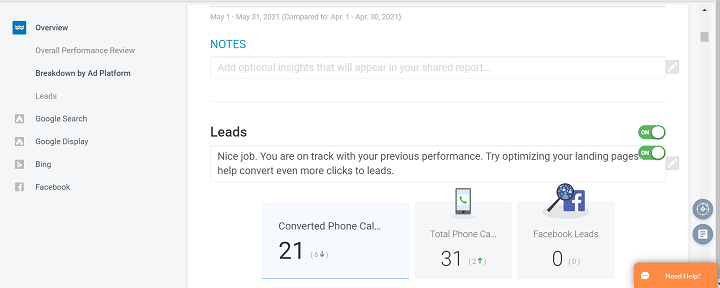
When you’re crunching data, sometimes that “north star” main point gets lost along the way. Don’t let that happen by always trying to keep your “big picture” goals in mind. Otherwise, if someone’s staring at numbers with no context, they’re just that: numbers. However, those numbers mean something when you apply how they relate to your business growth or the current state of your marketing strategies within the real world.
Try including a quick sentence below charts or a notes section within your PPC reporting to explain what’s going on with the data. Perhaps include your reasoning behind why a metric went up or down, or mention external factors like a change in operating hours during that time frame. The more context you can provide in your data-driven strategy, the better.
Even if the report is just for yourself, you may not always remember exactly what was happening or what changes were made when looking back on those reports down the line.

3. Make sure there are clear takeaways
Treat your PPC reporting like you would any other part of marketing: you want to answer that question of “so what?”
On top of telling a story with your data, your PPC reporting should be action-oriented. The point of reporting is to guide yourself, your client, or your team on what to do next. Reports act as a sounding board for data-backed decisions on how you can improve your account.
Even with the best accounts, I always say there’s room for improvement in PPC. So take advantage of your PPC reporting to help you identify where you can improve. For example, similar to the notes section we mentioned above for context, you may also want to include a quick “recommendations” section where you input what you think should be the next few action items based on the data.
4. Get into a PPC reporting cadence
It’s been said many times before, but both in marketing and PPC, consistency is key!
Be sure to set up a regular report schedule and stick to it. For example:
- Weekly reports help you make tweaks to your tactics and campaigns during your day-to-day work in the account.
- Monthly reports help you to track goal progression.
- Quarterly reports help to inform you on high-level strategy efforts.
Whether you choose one that works best for your bandwidth or a mix of all three, keeping to a regular PPC reporting cadence will help you stay on track without letting anything slip through the cracks.
5. Check against industry benchmarks
PPC reporting allows you to see how your campaigns compare to one another and what progress you’re making over time, but it’s also important to see how your performance metrics compare to other advertisers in your industry. Here are some of our many benchmark reports:
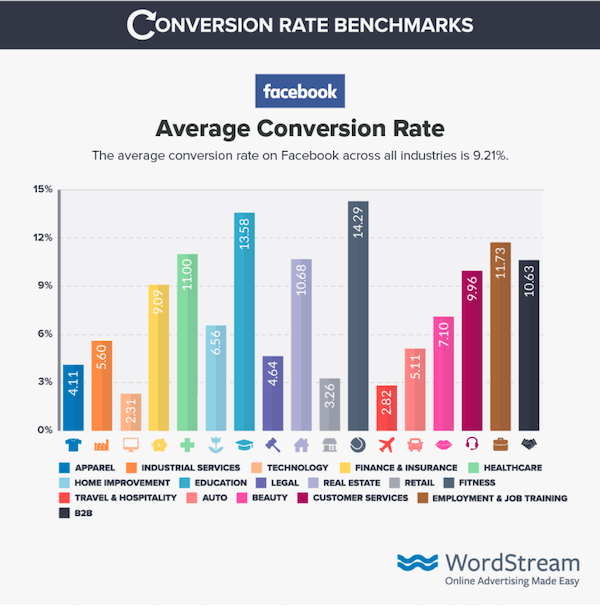
This way too, if something appears to be very low or very high, you may be able to reassure your boss, your client, or yourself that it is on par with industry averages.
PPC reporting pitfalls to avoid
Knowing what not to do is just as important as knowing what to do when it comes to PPC reporting. Check out these PPC reporting pitfalls you’ll want to avoid:
1. Focusing on the wrong metrics
Your first instinct might be to immediately start evaluating your CPA or conversions. Without understanding how you got there, though, you’ll be quick to make decisions that may help that one core metric but not your overall goals.
Here’s how to avoid this PPC reporting pitfall:
Check all key metrics
Be sure to check out all of the key metrics that impact your performance, not just the ones that relate to your return. For example, while a good click-through rate may not seem to matter when it comes down to how many conversions you brought in, it’s a huge factor in how high you rank on the SERP which can impact your conversions inadvertently.
Choose one set
If you’re unsure what PPC metrics you should prioritize, start with identifying at least five main metrics that mean most to your business’s overall account health, and stick to those when conducting your PPC reporting.

Continuously report
Just like how keeping to a consistent PPC reporting schedule is vital, continuously reporting on the same metrics is just as important.
Not only will this help you get a better idea of everything going on in your performance, but it will also make it easier to look back on historical reports. If you’re focusing on one set of PPC reporting metrics one month, and a different set the next, your data will get lost in the plot when you’re trying to tell that reporting story over time.
2. Using the wrong PPC reporting visuals
Have you ever seen a performance chart that at first glance had jaw-dropping data, but as you looked closer at the numbers, you saw that there were just huge gaps in between the lines that made certain differences look larger or smaller than they really are?
Don’t do this! While we want all visuals to paint us in the best light, it’s more important that they’re as accurate as possible. Try playing around with two different types of graphs with the same data set to see which one fits better. If you’re unsure what types of visuals to use, check out some PPC reporting examples online or see how other areas of your business are visually representing data to compare.
Check out this example from Frederick Vallaeys.
In the below image, we see the data being displayed in a pie chart showing huge differences between devices:
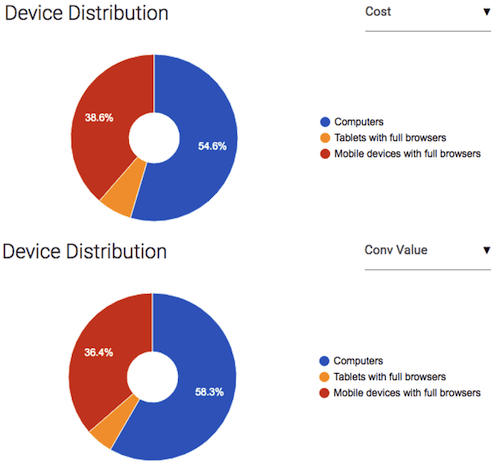
However, with the raw numbers taken out of percentage format and put into a table, you can see there isn’t really a huge gap:

3. Spending more time on PPC reporting than optimizing
I’ll admit, PPC reporting is important, but not so important it should be taking up your whole work week. Next to keyword research, PPC reporting takes up the most time out of an advertiser’s day. But it shouldn’t have to!
Establishing a process early on that you can stick to will keep you from wasting time on guessing how you should do your reports each time. Plus, if your reporting method is the exact same each time you’ll be able to streamline your PPC reporting, or even automate it. You can also leverage online PPC reporting tools to help you avoid this pitfall—which we’ll get into next!

PPC reporting tools to make your life easier
If you feel like manually commandeering your PPC reporting is out of the question, there’s plenty of great solutions out there to help you out. Here are some common PPC reporting and analysis tools you could try:
1. Platform-specific reports
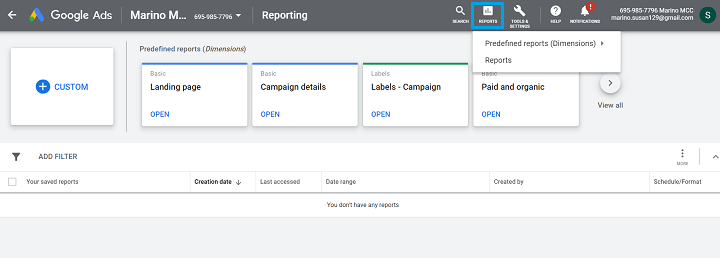
Google ads, Facebook ads, Microsoft ads, Twitter, LinkedIn and everything in between offers some type of reporting within their own platform. If you don’t have the resources to ramp up a new third party tool, using what’s already readily available to you within the platform can be just as helpful.
You can even take screenshots of dashboards, or schedule your Google Ads reports and have them ready to go. If you’re unsure where to start when it comes to PPC reporting, exploring reporting capabilities right from within your accounts is a great place to kick your PPC reporting off.
2. Google Data Studio
Google Ads Data Studio was released a few years back, and has now become a heavily leveraged tool among the PPC and general marketing community.
Data Studio aggregates your PPC data along with your other data sources, like Google Analytics, to give you detailed information on both your paid and organic performance. Set up is easy, and it’s free to use. Plus, you can share and download the reports.
Data Studio is great for someone ready to take their PPC reporting a step beyond what’s readily available in the ad platforms themselves, without having to sacrifice a ton of time or resources.

3. Google Analytics
This one is a given. If you’re advertising on Google Ads, odds are you’ve already linked Google Ads to Google Analytics. But Analytics can also report on so much more, like organic and social performance across your site.
Additionally, you can use Google Analytics to understand your audience and top paths of the customer journey. Unlike some of the other tools, where you’re at the mercy of the pre-set metrics and visuals, Google Analytics is also extremely customizable.
If you’re looking for more advanced, custom reports, Analytics is a fitting solution.
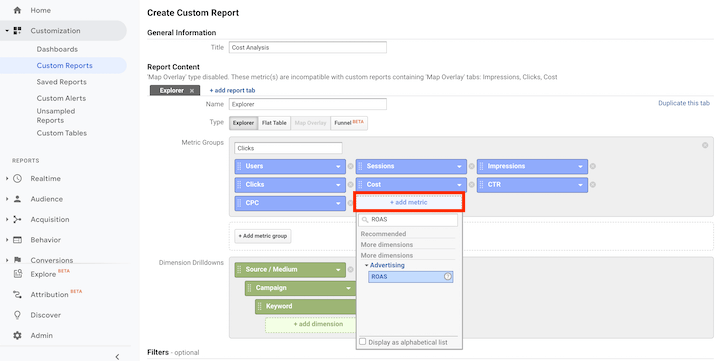
Learn how to view and analyze cost data from all platforms in GA here.
4. Third-party PPC reporting tools
On top of the free-to-use Google and platform-specific tools mentioned above, there’s of course a plethora of third-party tools you can pay to use.
When looking for a third-party tool, price of course comes first. Outside of cost, however, think through it similar to your reporting goals.
Based on what we covered today, here is a list of questions to ask when choosing a third-party PPC reporting tool:
- What are my goals and how can this tool report on those points?
- What metrics are most important to me, and can this tool report on all of those as in-depth as I’d like?
- Do I need to share these reports with anyone? If so, does the tool allow for those types of capabilities?
- How customizable do I want my reports to be?
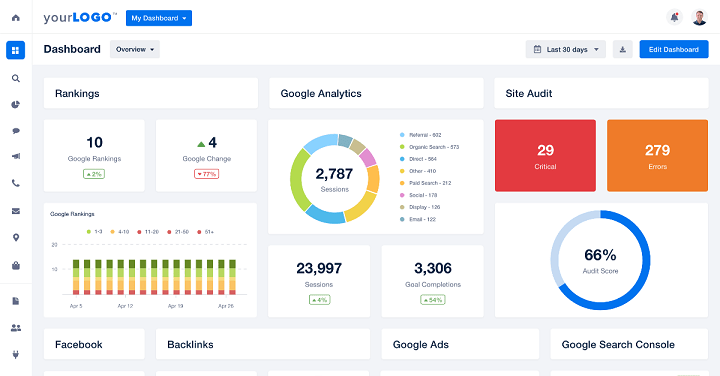
There are plenty of third-party tools out there like, SEMRush, Agency Analytics, Reporting Ninja, and more.
Master PPC reporting for peak account performance [recap]
PPC reporting is vital to consistent growth with any account. Use this complete guide to PPC reporting as your reference as you go off into your accounts to start reporting!
Remember, there’s no set formula for the perfect PPC report. So do what works for you. Just be sure to stick with the tips and best practices provided above.
We covered just about everything there is to know about PPC reporting, so to recap:
1. Clarify your PPC reporting goals and identify attributes and metrics to include accordingly.
- Provide an overview/executive report
- Prove ROI
- Showcase your work
- Track your progress
- Highlight trends
2. Keep these four PPC reporting tips in mind:
- Use custom columns
- Tell a story with the data
- Provide key takeaways
- Stick to a regular reporting cadence
3. Avoid these three PPC reporting pitfalls:
- Looking at the wrong metrics
- Using deceiving visuals
- Wasting too much time on reports
4. If you’re stuck, here are a few PPC reporting tool options:
- The platform’s data
- Google Ads Data Studio
- Google Ads Analytics
- Third-party tools

