Facebook advertising has been a staple strategy for small businesses for years now—which is no surprise considering it’s been proven that Facebook delivers the highest ROI out of all social ad platforms.
Plus, with more than 3 billion monthly active users, there are endless opportunities to reach any audience you want to target on Facebook. Not only that, but Facebook ads also tend to be less costly than search ads. So, when you’re looking to build brand awareness, connect with prospects, and get new customers fast, Facebook ads are a no-brainer.
However, knowing exactly how your Facebook campaigns are performing can be a challenge. Today, we’ve got the data to help you solve for this.
As you map out your Facebook ad campaigns for the remainder of 2024 and consider your strategy for 2025, we’re sharing Facebook ads benchmarks across 20 industries, including data for core metrics such as click-through rate, cost per click, conversion rate, and more for two popular Facebook ads campaign objectives: traffic and leads.

Contents
- Key trends: The big picture
- Facebook ads benchmarks: Traffic campaigns
- Facebook ads benchmarks: Leads campaigns
- How to improve your Facebook ads results
🏃 Want to take this data to go? Download our free 2025 Facebook ads benchmarks report here!
Key trends: The big picture
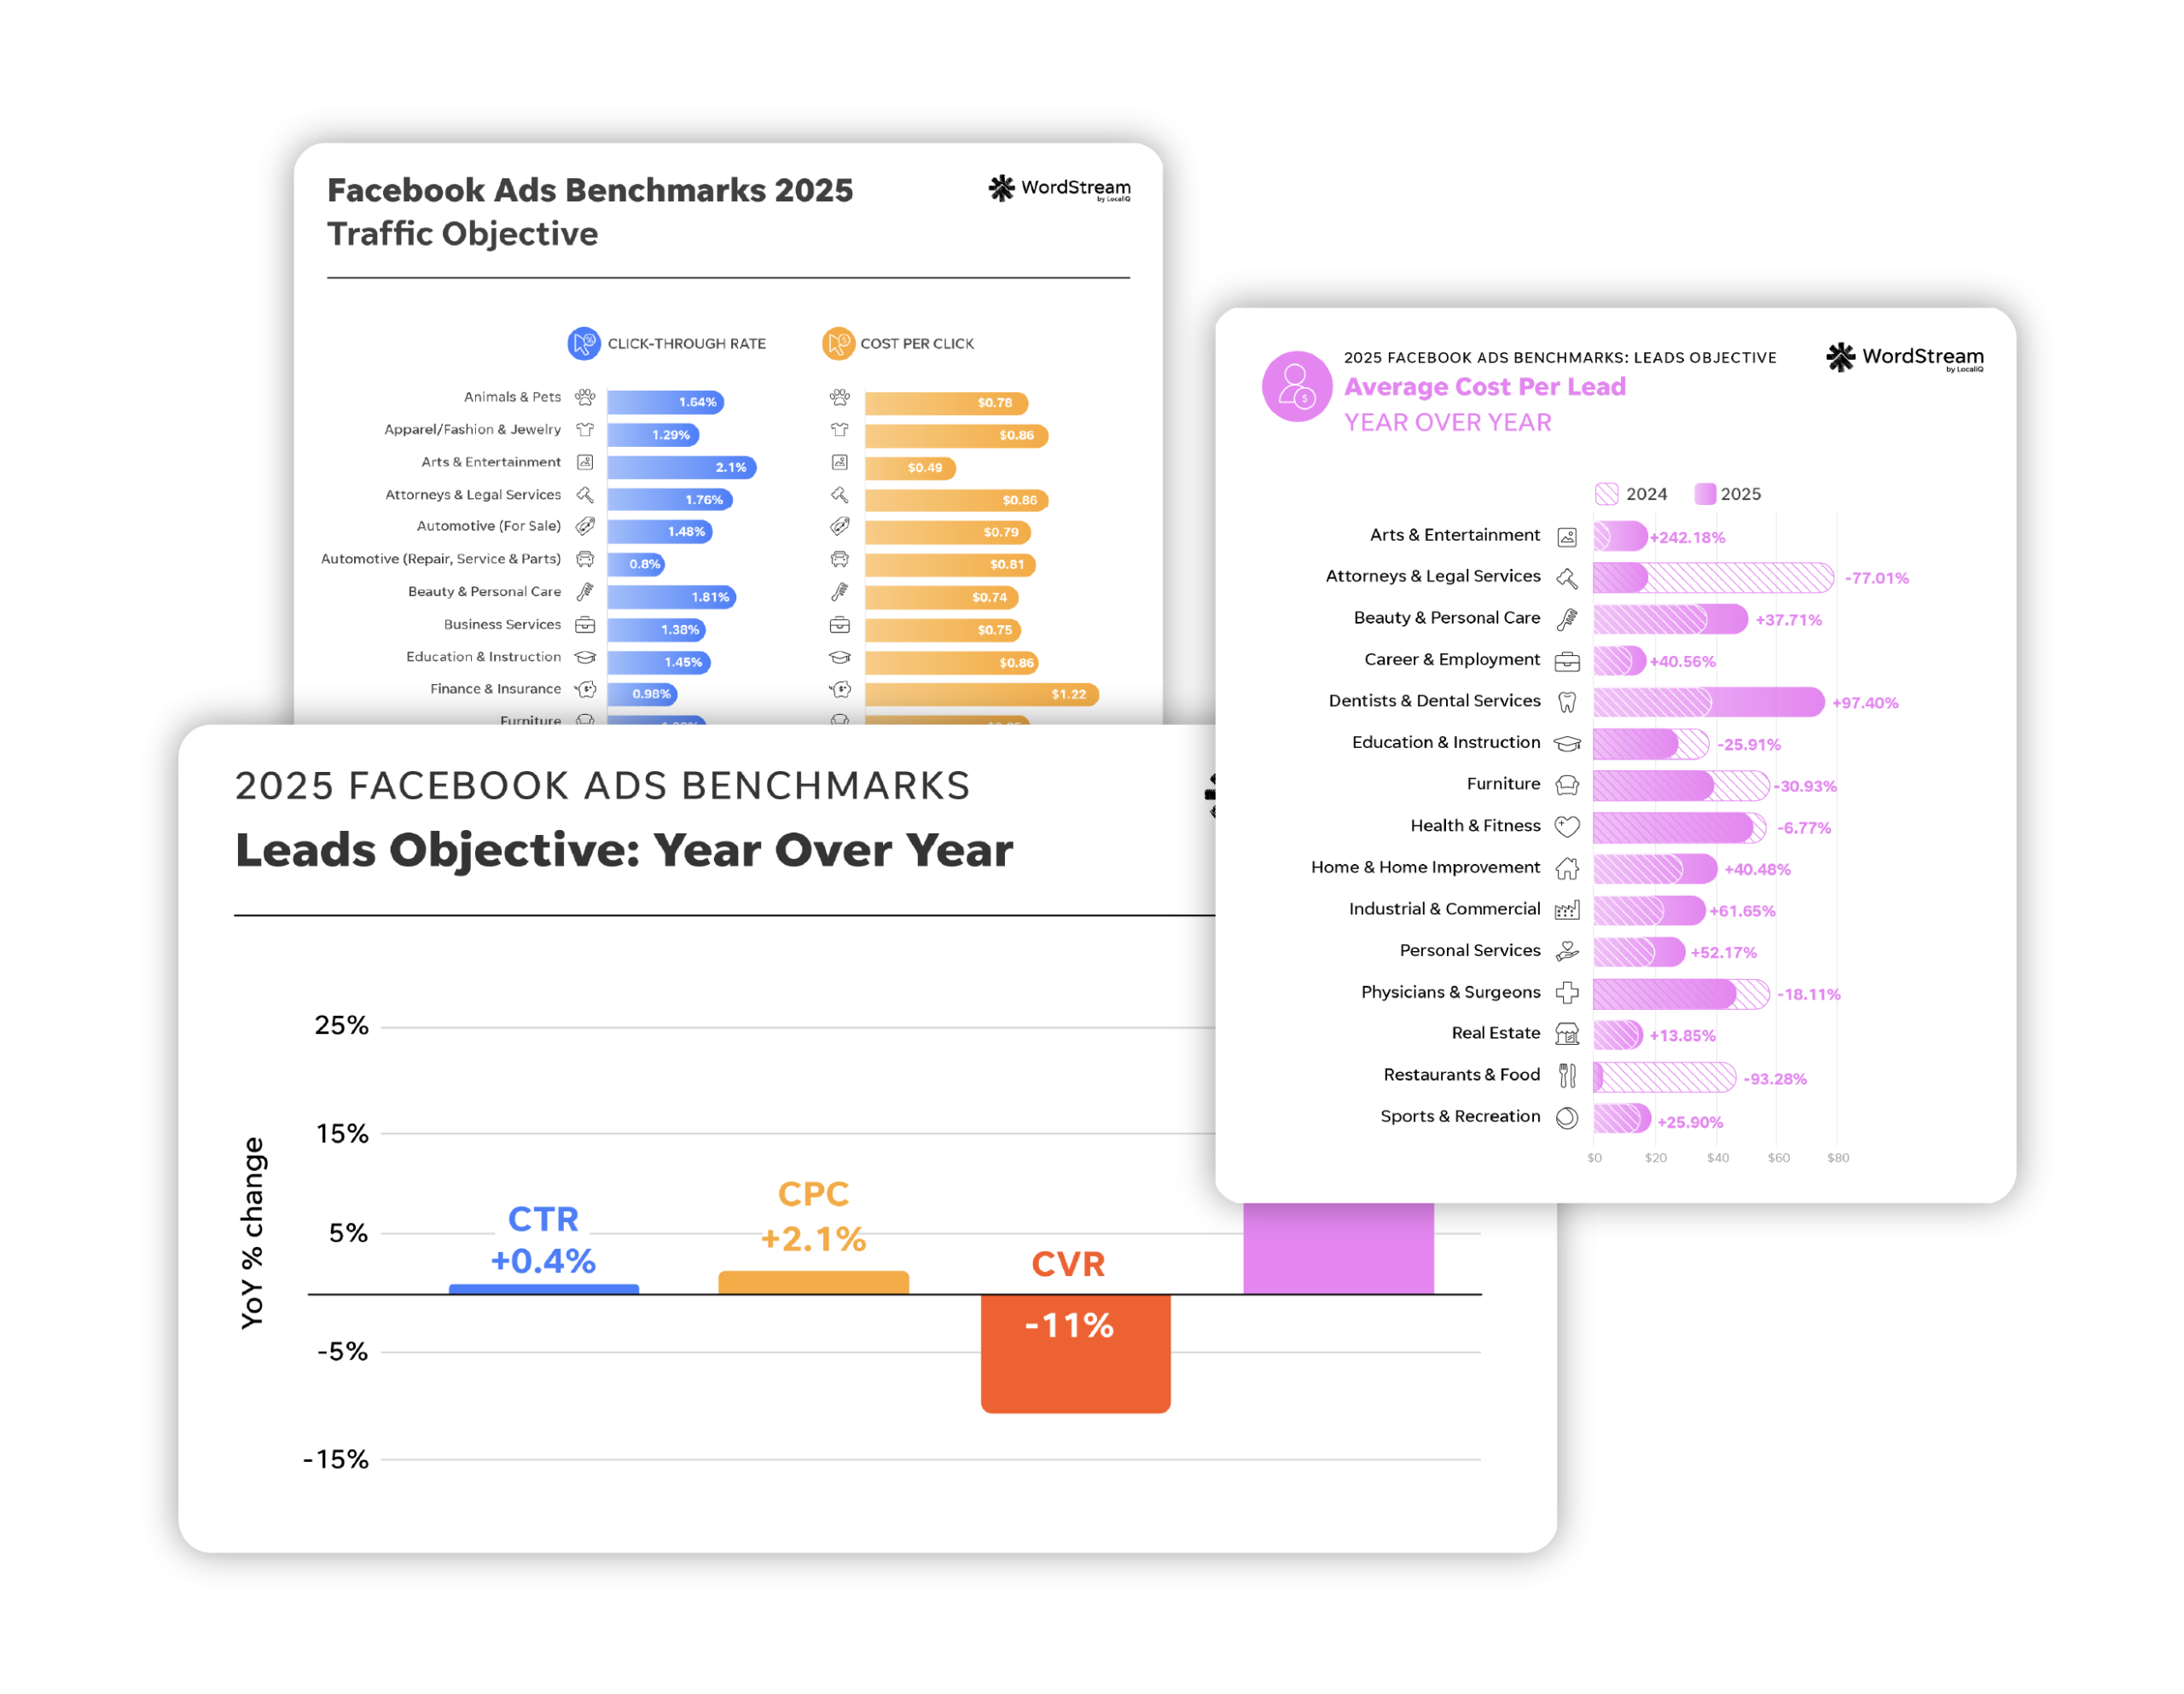
Over the last couple of years on the search ads side, most industries have seen a decline in performance and an increase in costs. Facebook ads, however, are seeing relatively stable, and in many cases improved, results. Although running Google Ads is still critical for business growth online, this speaks to the importance of leaning into Facebook ads as well.

As you can see, click-through rate and conversion rate both increased this year, while cost per click and cost per lead went down.
Let’s take a closer look at the main takeaways from this Facebook ad benchmark data.
- For Facebook Lead Ads, click-through rate (CTR) decreased for 12 out of 15 industries. This is the opposite of what we saw for Google Ads, which saw increases in CTR for most industries. Despite this, overall average CTR across all industries did improve slightly. Plus, while you should prioritize a high CTR for your Facebook Ads, this isn’t the most important metric for lead ads. In contrast, CTR increased year over year for 15 out of 23 industries in the traffic objective, (a reversal from last year when 15 industries saw CTR decrease).
- Average cost per click (CPC) for the leads objective increased for 12 out of 15 industries (80%). This follows a similar trend we saw in our Google Ads benchmarks, where 86% of industries saw an increase in CPC. CPC is still relatively low for lead ads at $1.88, compared to $4.66 in Google Ads. Meanwhile, cost per click largely decreased year over year for the traffic objective. 18 industries saw a decrease (and two saw no change) YoY.
- Conversion rate (CVR) improved for 10 out of 15 industries using the lead gen objective, with some of those increases being fairly significant. The big winners were Industrial and Commerical, Dentists and Dental Services, and Real Estate. Overall, average CVR rate increased YoY for lead ads.
- For the leads objective, cost per lead (CPL) decreased for six out of 15 industries, which means 60% of industries saw an increase in CPL, with an average CPL across industries of $21.98. This is substantially lower than the average CPL of Google Ads at $66.69. It’s also interesting to note that CPL decreased YoY for lead ads. Because lead ads are optimized to drive leads, this could account for the lower CPL.
The overall key takeaway? Facebook advertising continues to be the perfect complement to search ads because of lower and more stable costs year over year.
“People’s spending habits are ramping up on social platforms like Facebook due to the advancements both Meta and TikTok have made in recent years,” said Tyler Mask, Senior Manager of Social Advertising and Custom Solutions at LocaliQ.
“Many consumers are searching for businesses on social media first in lieu of traditional search platforms. We are seeing social platforms increasingly fill all stages in the marketing funnel, whereas search now tends to be a more bottom-of-funnel strategy.”
It’s interesting that Facebook costs have remained relatively stable since 2021, while Google ad costs have been increasing for years. One possible factor is that Facebook’s user base has continued to grow for eight years running, whereas Google has recently begun to lose market share (though it’s still the most popular search engine by far).
Another possible explanation is that people are spending more time scrolling on Facebook than they are searching on Google. The average person spends up to 35 minutes on Facebook per day—while only taking a few minutes to make three to four Google searches throughout the day.
Third, it might simply be a matter of how Google runs its business. For example, in the Google antitrust trial, executives including Jerry Dischler, VP and General Manager of Google Ads, testified that the platform was manipulating ad prices. Facebook, however, doesn’t have the same kind of monopoly when it comes to social media platforms.

Facebook ads benchmarks: Traffic campaigns
The traffic objective in Facebook ads is one of a few campaign objectives advertisers can choose from. Using the traffic objective allows Facebook’s algorithm to optimize how your campaign is served to drive the most possible clicks on your ads.
Traffic campaigns are a common go-to for many small business advertisers because they help drive more visitors (and potential customers!) to your website or landing page, app, or event.

| Business Category | Avg. CPC | Avg. CTR |
| Animals & Pets | $0.58 | 1.87% |
| Apparel / Fashion & Jewelry | $1.07 | 1.14% |
| Arts & Entertainment | $0.43 | 2.59% |
| Attorneys & Legal Services | $1.09 | 0.99% |
| Automotive — For Sale | $0.79 | 1.02% |
| Automotive — Repair, Service & Parts | $0.96 | 1.10% |
| Beauty & Personal Care | $0.94 | 1.51% |
| Business Services | $0.84 | 1.16% |
| Career & Employment | $0.67 | 1.41% |
| Dentists & Dental Services | $1.07 | 0.88% |
| Education & Instruction | $0.77 | 1.21% |
| Finance & Insurance | $1.05 | 0.85% |
| Furniture | $1.06 | 1.21% |
| Health & Fitness | $0.81 | 1.61% |
| Home & Home Improvement | $0.88 | 1.26% |
| Industrial & Commercial | $0.77 | 0.99% |
| Personal Services | $0.81 | 1.37% |
| Physicians & Surgeons | $0.96 | 1.07% |
| Real Estate | $0.65 | 2.60% |
| Restaurants & Food | $0.51 | 2.19% |
| Shopping, Collectibles & Gifts | $0.68 | 1.67% |
| Sports & Recreation | $0.72 | 1.27% |
| Travel | $0.42 | 2.20% |
Note: Since this campaign objective is specifically designed to drive traffic, cost per lead and conversion rate metrics tend to be on the higher side. It’s important to focus on the metrics that matter most for your ad objective, so we’ve omitted those metrics here.
💡 Find out which approach to Facebook ads might be right for your business using our free guide to the 16 most effective strategies for Facebook Ads!
Average click-through rate for traffic campaigns
Since Facebook ads traffic campaigns are focused on clicks, average click-through rate naturally becomes the focus PPC metric for most advertisers using this strategy.
The average click-through rate in Facebook ads for traffic campaigns across all industries is 1.57%. This is up from last year’s overall average of 1.51%.

| Business Category | Avg. CTR |
| Animals & Pets | 1.87% |
| Apparel / Fashion & Jewelry | 1.14% |
| Arts & Entertainment | 2.59% |
| Attorneys & Legal Services | 0.99% |
| Automotive — For Sale | 1.02% |
| Automotive — Repair, Service & Parts | 1.10% |
| Beauty & Personal Care | 1.51% |
| Business Services | 1.16% |
| Career & Employment | 1.41% |
| Dentists & Dental Services | 0.88% |
| Education & Instruction | 1.21% |
| Finance & Insurance | 0.85% |
| Furniture | 1.21% |
| Health & Fitness | 1.61% |
| Home & Home Improvement | 1.26% |
| Industrial & Commercial | 0.99% |
| Personal Services | 1.37% |
| Physicians & Surgeons | 1.07% |
| Real Estate | 2.60% |
| Restaurants & Food | 2.19% |
| Shopping, Collectibles & Gifts | 1.67% |
| Sports & Recreation | 1.27% |
| Travel | 2.20% |
The industries with the highest average click-through rates for Facebook traffic campaigns were Real Estate (2.60%), Arts and Entertainment (2.59%), and Travel (2.20%).
In contrast, the industries with the lowest average click-through rates were Finance and Insurance, Dentists and Dental Services (0.88%), and Attorneys and Legal Services as well as Industrial and Commercial (0.99%).
To reiterate, click-through rate increased or remained the same for 15 out of 23 industries—which is more in line with what we saw in our Google Ads benchmarks. Because these campaigns are optimized for the traffic objective, it makes sense that they would have a higher CTR than lead gen campaigns (more on this later).
Average cost per click for traffic campaigns
Similar to click-through rate, cost per click is also a primary metric advertisers focus on when running Facebook ads traffic campaigns. Since you’re driving as many clicks as possible with this campaign objective, you want to ensure those clicks are as cheap as they can be.
In short, keeping a lower average CPC on traffic campaigns means you can convert website visitors at an overall cheaper cost.
The average cost per click in Facebook ads for traffic campaigns across all industries is $0.77. This is down from last year’s average of $0.83.

| Business Category | Avg. CPC |
| Animals & Pets | $0.58 |
| Apparel / Fashion & Jewelry | $1.07 |
| Arts & Entertainment | $0.43 |
| Attorneys & Legal Services | $1.09 |
| Automotive — For Sale | $0.79 |
| Automotive — Repair, Service & Parts | $0.96 |
| Beauty & Personal Care | $0.94 |
| Business Services | $0.84 |
| Career & Employment | $0.67 |
| Dentists & Dental Services | $1.07 |
| Education & Instruction | $0.77 |
| Finance & Insurance | $1.05 |
| Furniture | $1.06 |
| Health & Fitness | $0.81 |
| Home & Home Improvement | $0.88 |
| Industrial & Commercial | $0.77 |
| Personal Services | $0.81 |
| Physicians & Surgeons | $0.96 |
| Real Estate | $0.65 |
| Restaurants & Food | $0.51 |
| Shopping, Collectibles & Gifts | $0.68 |
| Sports & Recreation | $0.72 |
| Travel | $0.42 |
Industries that had the highest average costs per click for Facebook traffic campaigns were Attorneys and Legal Services ($1.09), Apparel, Fashion and Jewelry as well as Dentists and Dental Services ($1.07) and Furniture ($1.06).
The industries with the lowest average costs per click for Facebook traffic campaigns included Travel ($0.42), Arts and Entertainment ($0.43), and Restaurants and Food ($0.72).
Cost per click decreased or remained the same for 20 out of 23 industries. That said, even if you find your industry’s CPC has increased, it’s important to keep in mind that these CPCs are still generally lower than the average CPC for Google Ads at $4.66.
Facebook ads benchmarks: Leads campaigns
Facebook ad campaigns using the lead gen objective are designed to maximize lead collection for advertisers by allowing users to contact your business via form fills, messages, calls, and conversions.
Leads campaigns require you to use Facebook Lead Ads, which are a Facebook ad type that include prompts directly within the ad to collect lead information.
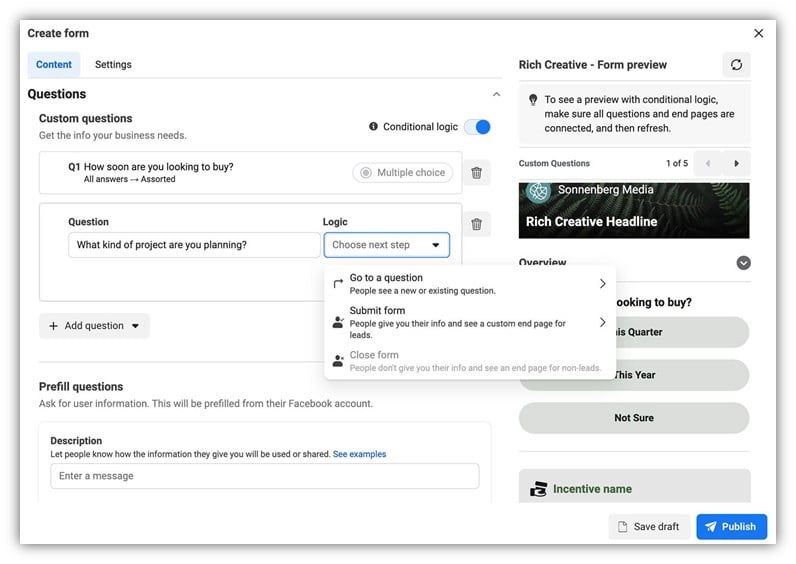
An example of a Facebook Lead Ad form buildout.

| Business Category | Avg. CPC | Avg. CPL | Avg. CTR | Avg. CVR |
| Attorneys & Legal Services | $8.50 | $104.58 | 1.61% | 7.57% |
| Automotive — Repair, Service & Parts | $3.82 | $81.45 | 1.08% | 4.86% |
| Beauty & Personal Care | $2.44 | $42.10 | 2.26% | 5.93% |
| Business Services | $1.52 | $16.95 | 2.70% | 8.34% |
| Dentists & Dental Services | $4.10 | $32.46 | 1.54% | 9.83% |
| Education & Instruction | $2.03 | $31.82 | 2.32% | 8.49% |
| Finance & Insurance | $4.57 | $38.09 | 1.84% | 5.98% |
| Furniture | $2.10 | $39.25 | 2.36% | 6.11% |
| Health & Fitness | $3.29 | $57.40 | 1.46% | 5.78% |
| Home & Home Improvement | $2.18 | $24.29 | 1.78% | 8.87% |
| Industrial & Commercial | $2.77 | $24.53 | 1.48% | 12.03% |
| Personal Services (Weddings, Cleaners, etc.) | $1.93 | $20.49 | 2.56% | 9.19% |
| Physicians & Surgeons | $2.83 | $57.97 | 2.43% | 4.81% |
| Real Estate | $1.36 | $13.87 | 3.71% | 9.70% |
| Sports & Recreation | $1.20 | $14.59 | 3.74% | 8.87% |
We’ve included conversion rate and cost per lead as part of these benchmarks since this objective is optimized to drive leads and conversions.
Average click-through rate for leads campaigns
While Facebook Lead Ads don’t necessarily require users to click to your website (although that can still be a secondary option on the ad), you still need to get your prospects to click on the ad to become a lead. So, prioritizing a high click-through rate for your Facebook leads objective campaigns is the first step in getting prospective customers to take action.
The average click-through rate in Facebook ads for leads campaigns across all industries is 2.53%. This is slightly higher than last year’s overall average of 2.50%.

| Business Category | Avg. CTR |
| Attorneys & Legal Services | 1.61% |
| Automotive — Repair, Service & Parts | 1.08% |
| Beauty & Personal Care | 2.26% |
| Business Services | 2.70% |
| Dentists & Dental Services | 1.54% |
| Education & Instruction | 2.32% |
| Finance & Insurance | 1.84% |
| Furniture | 2.36% |
| Health & Fitness | 1.46% |
| Home & Home Improvement | 1.78% |
| Industrial & Commercial | 1.48% |
| Personal Services | 2.56% |
| Physicians & Surgeons | 2.43% |
| Real Estate | 3.71% |
| Sports & Recreation | 3.74% |
Industries with the highest average click-through rates were Sports and Recreation at 3.74%, Real Estate at 3.71%, and Personal Services at 2.56%.
Industries with the lowest average click-through rates were Automotive Repair, Service and Parts (1.08%), Health and Fitness (1.46%), and Industrial and Commercial (1.48%).
When looking at these Facebook ads lead objective click-through rates, it can be helpful to consider your own customer journey map.
For example, the industries with the lowest average click-through rates, such as Automotive Repair, Service and Parts and Industrial and Commercial, may have a longer sales cycles and prospective customers may spend more time in the consideration phase of their buyer’s journey before they become a lead.
Average cost per click for leads campaigns
You get charged for clicks on your Facebook Lead Ads regardless of whether those clicks turn into leads or not. That’s why it’s key to keep your average cost per click as low as possible to, in turn, lower your cost per lead, avoid wasted spend, and maximize the number of clicks your campaign budget can afford.
However, keep in mind that you’ll also need to balance lead quality versus quantity. For example, you might find it’s worth it to stretch your budget and pay a slightly higher CPC if it equates to higher quality leads.
The average cost per click in Facebook ads for leads campaigns across all industries is $1.88. This is a bit lower than last year’s average of $1.92.

| Business Category | Avg. CPC |
| Attorneys & Legal Services | $8.50 |
| Automotive — Repair, Service & Parts | $3.82 |
| Beauty & Personal Care | $2.44 |
| Business Services | $1.52 |
| Dentists & Dental Services | $4.10 |
| Education & Instruction | $2.03 |
| Finance & Insurance | $4.57 |
| Furniture | $2.10 |
| Health & Fitness | $3.29 |
| Home & Home Improvement | $2.18 |
| Industrial & Commercial | $2.77 |
| Personal Services | $1.93 |
| Physicians & Surgeons | $2.83 |
| Real Estate | $1.36 |
| Sports & Recreation | $1.20 |
The industries that spend the most per average click for Facebook lead gen campaigns were Attorneys and Legal Services at $8.50, Finance and Insurance at $4.57, and Dentists and Dental Services at $4.10.
Alternatively, the industries with the lowest cost per click for Facebook lead gen campaigns were Sports and Recreation ($1.20), Real Estate ($1.36), and Business Services ($1.52).
Regardless of whether your CPC is up or down, it’s important to remember that while the lead gen objective is focused on lead conversions, cost per click can still be a key performance indicator for your campaigns.
“Conversions have to be the main metric we focus on, however, given that Meta requires so many conversions for its algorithm, it can be helpful to pay attention to average CPC as well. CPC rising means fewer people are clicking on your ad, and that could be due to ad fatigue or the wrong targeting,” said Navah Hopkins, PPC Evangelist at Optmyzr.
Average conversion rate for leads campaigns
Unlike traffic campaigns which are focused on clicks, the Facebook lead objective is a conversion-driven campaign strategy. Compelling Facebook ads are at the root of any Facebook leads campaign that has a high conversion rate.
When you have the right mix of ad copy, creative, and a coinciding landing page that best resonates with your target audience, you’ll see your conversion rate soar. Getting to that point, however, can take some time and testing—which is why watching your lead gen campaign CVR is so important to make data-backed Facebook ad optimizations.
The average conversion rate in Facebook ads for leads campaigns across all industries is 8.78%. This is higher than last year’s average of 8.25%.

| Business Category | CVR |
| Attorneys & Legal Services | 7.57% |
| Automotive — Repair, Service & Parts | 4.86% |
| Beauty & Personal Care | 5.93% |
| Business Services | 8.34% |
| Dentists & Dental Services | 9.83% |
| Education & Instruction | 8.49% |
| Finance & Insurance | 5.98% |
| Furniture | 6.11% |
| Health & Fitness | 5.78% |
| Home & Home Improvement | 8.87% |
| Industrial & Commercial | 12.03% |
| Personal Services | 9.19% |
| Physicians & Surgeons | 4.81% |
| Real Estate | 9.70% |
| Sports & Recreation | 8.87% |
The industries with the highest Facebook lead gen conversion rates were Industrial and Commercial (12.03%), Dentists and Dental Services (9.83%), and Real Estate (9.70%).
Meanwhile, the industries with the lowest conversion rates were Restaurants and Food (4.03%), Physicians and Surgeons (4.81%), and Automotive Repair, Service and Parts (4.86%).
The fact that conversion rates have increased for most industries using the lead gen objective isn’t a total surprise—the ease of filling out a form directly in-platform streamlines conversion paths.
“The in-platform lead form is more appealing for users for particular offers, and many businesses prefer the accuracy of the leads reporting compared to other conversion actions that have greatly reduced in accuracy over the years since iOS14,” said Brett McHale, Founder of Empiric Marketing.
Average cost per lead for leads campaigns
Cost per lead is typically the core, “money metric” for most advertisers. It indicates whether you’re getting the best bang for your buck from your Facebook leads campaigns.
The average cost per lead in Facebook ads for leads campaigns across all industries is $21.98. This is an improvement on last year’s average of $23.10.

| Business Category | Avg. CPL |
| Attorneys & Legal Services | $104.58 |
| Automotive — Repair, Service & Parts | $81.45 |
| Beauty & Personal Care | $42.10 |
| Business Services | $16.95 |
| Dentists & Dental Services | $32.46 |
| Education & Instruction | $31.82 |
| Finance & Insurance | $38.09 |
| Furniture | $39.25 |
| Health & Fitness | $57.40 |
| Home & Home Improvement | $24.29 |
| Industrial & Commercial | $24.53 |
| Personal Services | $20.49 |
| Physicians & Surgeons | $57.97 |
| Real Estate | $13.87 |
| Sports & Recreation | $14.59 |
The industries with the highest Facebook ad leads campaign costs per lead were Attorneys and Legal Services at $104.58, Automotive Repair, Services, and Parts at $81.45, and Physicians and Surgeons at $57.97.
The industries with the lowest cost per lead for Facebook ad lead gen campaigns were Real Estate ($13.87), Sports and Recreation ($14.59), and Business Services ($16.95).
While cost per lead is a critical metric when measuring Facebook ads campaign success, keep in mind that it may not be your only “end all, be all” metric.
“The most important metric for measuring success is the one the business is paying for. If they say they want leads, then CPL is king. If they say they need web traffic, CTR or CPC may be more important,” said Tyler.
How to improve your Facebook ads results
If you find that your Facebook ads results don’t align with your industry’s average, there are ways you can improve your Facebook ads with these four tips.
🚨 Ready to uncover more ways to optimize your Facebook ads? Get a free, instant account audit using our Facebook Ads Grader!
1. Leverage AI-powered creative tools for improved Facebook ad CTR
As you evaluate your campaign performance against the benchmarks above, you’ll want to factor in your Facebook ads creative. All Facebook ads, including lead ads, require a visual element such as a creative social media image or video. So, a more eye-catching industry, like Real Estate or Sports and Recreation, may naturally drive more clicks.
If you are in a typically lower CTR niche market, there are still ways you can improve your ad creative to be more compelling. Use design tools like Canva, or even AI-powered creative tools, to make your business stand out with more unique, visually appealing ads.
“The number one thing a business can do right now with their Facebook ads is take the polish off and focus on being real with their customers. Ads don’t have to look perfect, but they need to strike a chord. Ask yourself this: if your ads are perfect but you haven’t differentiated yourself from the market, why would someone choose you over a competitor?” said Tyler.
Getting creative with your formats and placements, with the help of AI, could also lead to decreased CPC and CPL averages for your account.
“The positive performances in metrics like CPC and CPL could be due to a combination of factors. For example, there is now a wider variety of ad placements and creative formats available that increase the amount of real estate ads can take up. There’s also rapid adoption of AI-driven tools (like Advantage+ audiences) in both targeting and dynamic ad copy generation to be considered,” said Brett.

Jasper is one AI tool you can use to create product images for Facebook ads.
2. Enhance conversion rates using the Facebook ads conversions API
Since your Facebook ads conversion rate is dependent on the actions you choose to track, having a clean way to catch all potential conversions coming from your ads is crucial.
The Facebook ads conversions API is a tool offered within Meta Business Suite to share key web or offline conversion events directly from your server to Facebook’s. Essentially, it connects your website data to Facebook ads without having to use third-party cookies like the Facebook pixel would.
In short, the conversions API is Facebook’s solution for tracking in-platform performance by matching back to user attributes tracked in your CRM (customer relationship management) system. Setting up conversions API usually takes the assistance of a developer or marketing partner, but it can be well worth it for enhanced conversion tracking. For example, with the conversions API you could track offline conversions such as in-store visits—which could increase your campaign’s average conversion rate.
3. Try Advantage+ audiences to lower your CPC and CPL
Facebook now offers Advantage+ audience targeting that allows you to reach beyond who you’d typically target manually to unlock new potential customers. When you widen your reach using an Advantage+ audience, you may find your costs go down as Facebook’s machine learning serves your ads to audiences that best align with your campaign objectives.
With this strategy, you might tap into users who are more likely to click or convert—increasing your CTR and CVR can bring down your average costs.
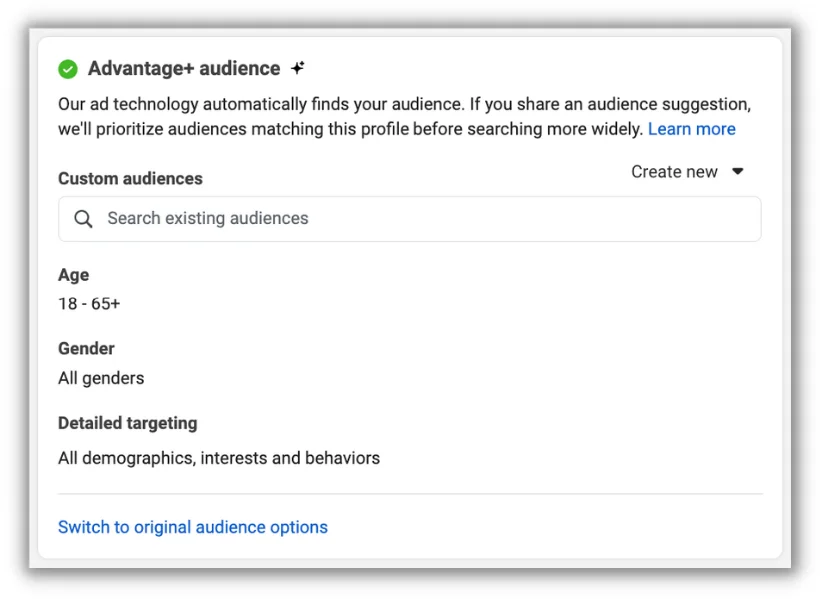
However, as you lean into AI-powered campaign capabilities, err on the side of caution as machine learning within Facebook ads is still developing. For example, Advantage+ audiences on the audience suggestions you provide.
“Many advertisers are struggling with quality clicks and leads more than ever with Meta’s strong encouragement of AI-based campaign settings that tend to drive more vanity metrics than bottom-line results. I believe as this technology progresses the quality will improve, however,” said Brett.
4. Complement your strategy with other channels
Treat your Facebook ads campaigns as just one part of a holistic, all-encompassing marketing strategy. There are tons of other marketing channels you should use in tandem with Facebook ads to maximize your results across the board.
For example, you’ll likely want to also leverage other social media platforms, plus SEO and search ads, to supplement your Facebook Ads. This will increase your overall online presence and ensure you’re capturing customers across all potential touchpoints.
“This data shows a bigger trend in the industry where businesses are spreading their advertising budgets across different platforms to get the best reach and efficiency. Diversifying is still the smartest idea. I don’t recommend going all in on one channel, regardless of if it’s paid or not,” said Goran Mirkovic, CMO at Freemius.
Make the most of these 2024 Facebook ads benchmarks
These industry benchmarks can help you better understand how your Facebook ad campaign performance is pacing against your typical competitor. Additionally, this data can be a guiding light when you’re unsure of how to best measure your Facebook ads ROI or don’t have a ton of historical data to go off of.
If you find that your business’s Facebook ads performance doesn’t align with industry standard, that’s okay! Remember, every business is unique and no two Facebook ad accounts are the same. You may have to realign your goals with what’s achievable for your business, and try our Facebook ad tips above to move your account in the right direction.
Plus, you don’t have to take on all your Facebook ad optimization work alone. See how our solutions can help you solidify your strategy and maximize your Facebook ads campaigns.
About the data
These benchmarks are based on data from 2,946 campaigns running between February 1, 2023, and April 30, 2024. Averages are technically median figures to account for outliers. All currency values are posted in USD.

Meet The Author
Susie Marino
Susie is the Senior Content Marketing Specialist for WordStream and LocaliQ, where she uses her experience as a PPC consultant to share tips, tactics, and best practices in the ever-evolving marketing and advertising space. Susie’s work has been featured in publications such as Search Engine Land, MediaPost, Social Media Today, and others. Outside of work, Susie loves to get outside for some snowboarding or (once the cold weather melts away) hiking!
![How to Run Watch-Worthy Facebook Video Ads [Complete Tutorial]](https://www.wordstream.com/wp-content/uploads/2026/03/facebook-video-ads-feature-image.jpg)