As search marketers, we spend a lot of time analyzing crazy SEO algorithms (hello, Panda and Penguin) and constantly trying to reverse-engineer ranking factors in an attempt to increase our organic rankings.
Yet when it comes to paid search, there’s not nearly as much research, despite the fact that PPC, like SEO, is largely driven by an algorithm (Quality Score) which determines ad position, cost per click and many other factors.
By understanding how Quality Score works, Google Ads (formerly known as AdWords) can be cracked.
Keep in mind: we’re talking about the search network here. The display network can be insanely powerful in its own right, especially if leveraged with enticing creative. But that’s a story for another day.
In my article today, I’ll quantify the impact of Quality Score on your cost per click and cost per conversion. I’ll also explain to you (mathematically!) how Google calculates your Quality Score. Finally, I’ll share my three best tips on how to raise your Quality Scores, all in an effort to help you hack Google Ads to improve your ROI.
Warning – lots of data ahead. Let‘s begin!
How Quality Score impacts ad position
Quality Score is how Google grades the relevancy of keywords and ads in your Google Ads account. It’s reported on a scale of 1-10, from awful to amazing.
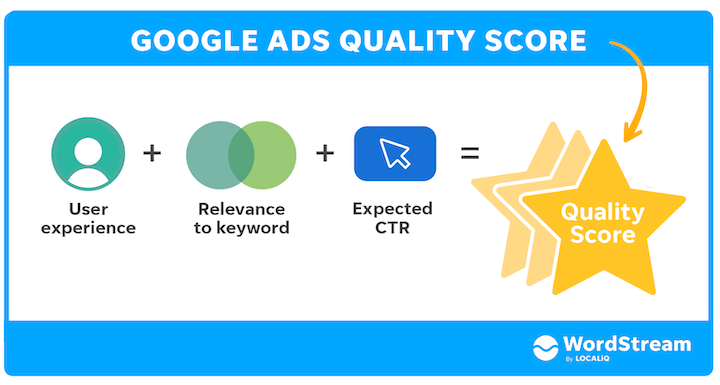
Why does Google care about ad quality? It’s obviously in no one’s best interests to show irrelevant ads that don’t appeal to users in the SERPs and throughout their network. Google only gets paid if people click on your ads, so they favor ads that people are likely to click. It’s that simple.
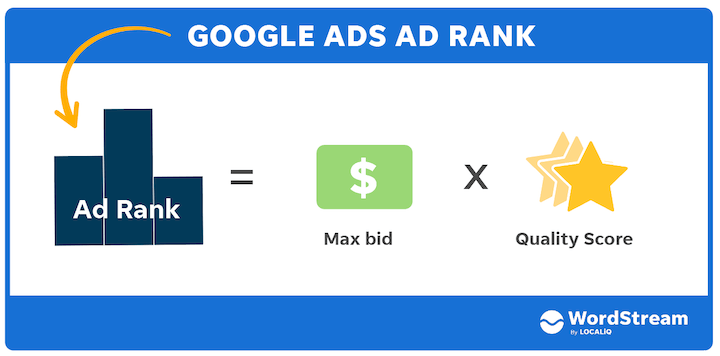
This means that bidding higher doesn’t always result in a higher position, because Max Bid is only part of the equation. Ads are ranked using “Ad Rank,” which is mostly the product of Max Bid * Quality Score (plus some other factors).
In the following figure, notice how Sam can get the top ad spot on the SERP, even though his Max CPC Bid—at $2—is lower than Mary’s Max Bid of $4.
Key takeaway: Quality Score greatly impacts ad exposure. In fact, Google doesn’t even bother showing ads with low Quality Scores.
How Quality Score impacts CPC
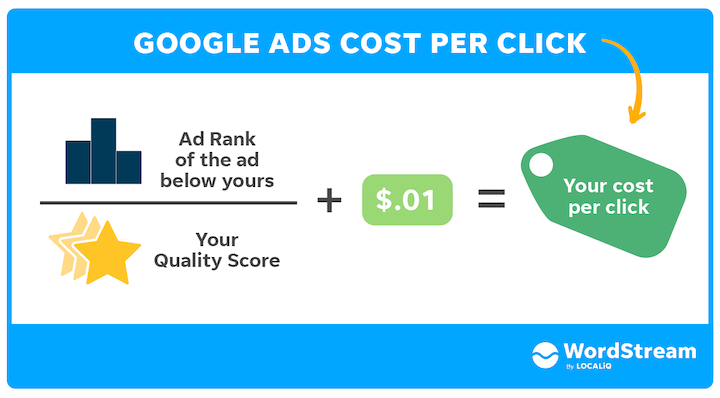
Quality Score also plays a very important role in determining how much you‘re charged per click. A now famous video by Hal Varian, Google’s Chief Economist, helped clarify this point. Your cost per click is calculated using the formula: [Ad Rank of the ad below yours / your Quality Score] + $0.01. Here’s an example of how this works:
Key takeaway: The higher your Quality Score, the greater your CPC discount. Conversely, lower Quality Scores result in much higher costs per click. Consider this a CPC tax for running dumb ads.
What is a good Quality Score?
If you’re getting perfect 10s on all of your keyword Quality Scores, let me know, because I’ve yet to see this in any account. Typically, you’ll get a mix. I analyzed a few hundred accounts to figure out what the typical Quality Score distribution looks like in 2013 and found that 7 is the most prevalent score.
Note that the impression-weighted Quality Score here for the average Google Ads account is around 5/10. Using this information, along with some basic arithmetic and the formula for calculating CPC, we can compute the economic value of having an above average Quality Score (or the penalty of having one below average).
Given that the average Quality Score is 5/10, the value of having a Quality Score of 10 is a discount of 50% on your CPC. The penalty of having a below average Quality Score of 1/10 is that your CPC is increased by 400%, on average. I’ve also included the marginal savings or cost increases for a 1-point increase or decrease in Quality Score.
It’s also worth noting that over the last 5 years, the average Quality Score has drifted lower. In 2009, the average Quality Score was 7/10. Today, it’s just 5/10. As a result, above average Quality Scores are worth much more than they were in the past!
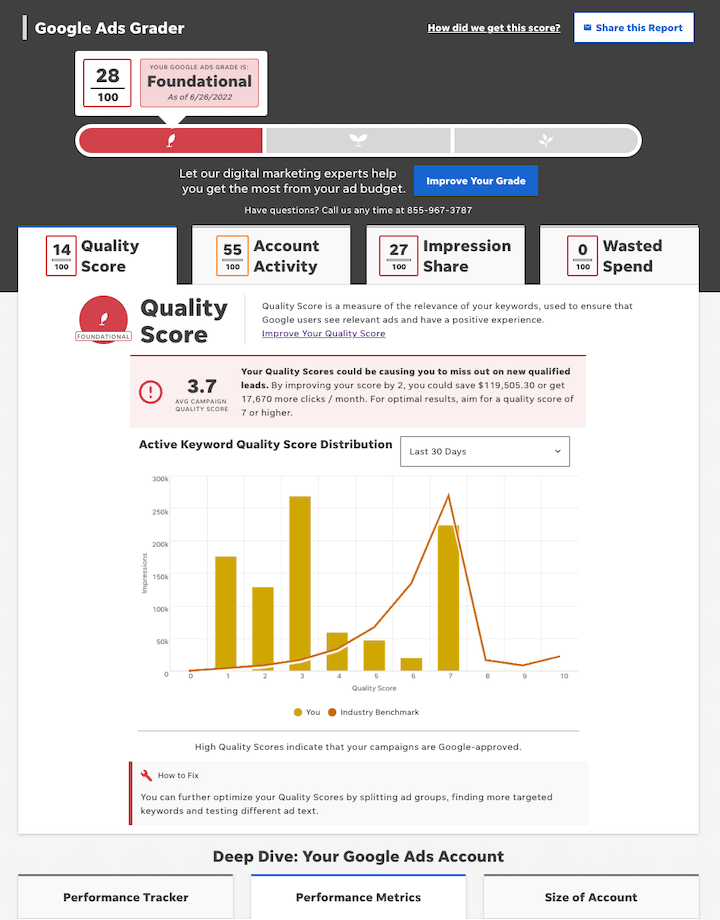
✴️ How does your Quality Score compare to others in your industry?
Find out with the Free Google Ads Performance Grader.
Impact of Quality Score on cost per acquisition
Most people doing PPC advertising are doing either e-commerce or lead generation/direct response marketing – they usually care more about cost per conversion or acquisition (CPA) than cost per click. After all, if you can turn a greater profit with a higher volume of clicks at $50 per click than $20, it makes sense.
To quantify the relationship between CPA and Quality Score, we manually compiled CPA data from several hundred WordStream client accounts, representing about $100 million in annualized spend.
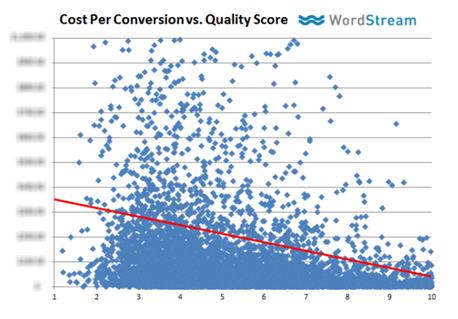
We then plotted the average cost-per-acquisition (conversion) versus the impression-weighted Quality Score for each campaign. Here’s what it looked like:
The data reveals that there is a very strong relationship between average cost per conversion and average Quality Score. The higher your Quality Score, the lower your CPA will be, on average.
The following table shows the impact of Quality Score on Cost Per Action (not conversion or acquisition) in comparison to the average Quality Score of 5/10.
Note that if your Quality Score is below average, you’ll basically pay a penalty – up to 64% more per conversion than your average advertiser. In a nutshell, for every Quality Score point above the average 5/10 score, your CPA will drop by 16%, on average. Conversely, for every Quality Score point below the average of 5/10, your CPA will rise by 16%.
It’s worth pointing out that I didn’t see a big difference in average conversion rates vs. Quality Scores. I found that keywords with high Quality Scores converted only slightly better than low Quality Score keywords.
Key takeaway: Lower CPAs are primarily driven by lower costs per click, which are a direct result of your Quality Score.
Hey! If you don’t want to read the whole article right now, why don’t you download it as a PDF to read on the train, on the plane, or wherever else there’s no internet?
How is Quality Score calculated?
Hopefully by now, you’re convinced that Quality Score has a huge impact on most of the important metrics in your account. So how does Google calculate this magical Quality Score?
A simple plot of Quality Score vs. CTR for a few hundred campaigns reveals a pretty strong relationship between the two.
Basically, the higher your CTR, the higher your Quality Score. Yet there’s still a bit of noise here by way of variance. What’s happening is that CTRs vary wildly based on average position: higher ad positions are predisposed to getting much higher CTRs, and low ad positions are likewise predisposed to low CTRs.
Here’s what the same data looks like when I account for different ad positions:
Notice there is a negative relationship between Average Position and account Quality Score along a constant CTR (the regressions shift upwards as position increases). This makes sense—if an ad in the first position has the same CTR as an ad in the third position, the ad in the third position likely has better relevance and consequently a higher QS.
Just as before, CTR has a logarithmic relationship with QS and improving CTR has diminishing returns in improving QS; improving CTR from 1% to 2% improves QS more than improving CTR from 2% to 3 or 4%.
The above graph shows that returns diminish faster for higher positions. Therefore, improving CTR from 1% to 2% for an ad in the third position raises QS by roughly 75%, whereas the same improvement in the number one ad only raises QS by roughly 60%.
For the top four positions (1.0 -4.0), CTR is a major indicator of QS, with roughly 50% correlation between the two variables. In the lower positions (4.0 and below), that correlation diminishes to roughly 30 to 35%, indicating that other issues (like poor landing page relevancy or ad relevancy) may have a larger weight on their poor QS.
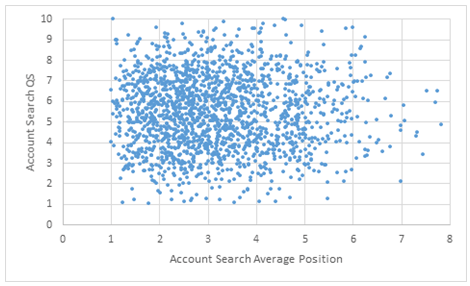
I didn’t see any strong direct relationship between QS and Average Position (R-squared = -.0000005, signaling no correlation), which means that you can’t buy a higher Quality Score simply by raising your keyword bids.
Key Takeaways:
- The higher your CTR, the higher your QS, though CTRs are influenced by ad position, which is a by-product of QS.
- There are diminishing returns in improving CTRs when it comes to QS and returns diminish faster the higher the ad position.
- CTR is a major indicator of QS in the top four ad positions.
- You can’t buy a higher QS by increasing your Max Bid.
Expected CTR and the effect of position on Quality Score
As we know, CTR has an exponential relationship with average position. I can figure out the average CTR in paid search by looking at a few accounts and seeing what happens, on average. Let’s call this the Expected CTR. It’s a rough definition, but a simple regression shows [CTR = .0673e^-.305(Avg. Position)], [R-squared =.2721]:
Using this Expected CTR formula, we can work out how the CTRs of these accounts compare with how we’d expect them to perform with their peers in similar positions.
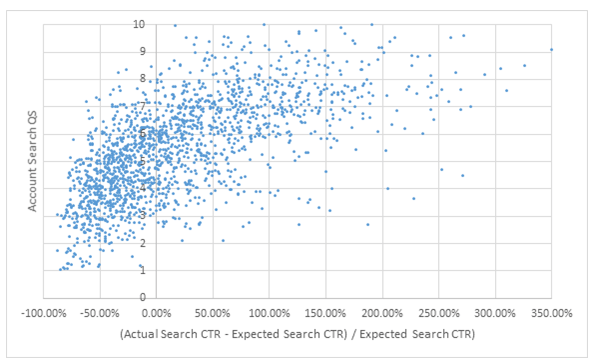
Below, I’ve plotted [Actual Search CTR – Expected Search CTR] / [Expected Search CTR vs. QS]. In short, as you travel from left to right along the x-axis, accounts improve their CTRs relative to their peers in similar positions, with 0% having “expected” CTRs for their position.
Adding 100% to all these x values makes all these values positive, allowing us to perform a logarithmic regression:
Key Takeaways:
- QS isn’t really affected by position. Instead, it’s affected by our CTR relative to our position. This is an important and substantial difference, because Google would like you to believe that CTR drives QS, to encourage people into higher positions. Increasing your bids may drive you into a better position and may increase your CTR, but likely won’t improve your QS.
- Those with an Expected CTR in their position likely have an average QS (around 5.5).
- Improving CTR below this Expected CTR drastically improves QS, but improving CTR above this metric has quickly diminishing returns.
There’s a ton of data in this article. Want to keep it on hand for later? Download this article as a PDF here –>
What does it all mean? Key takeaways
So how the heck do you start taking real, meaningful steps towards higher Quality Scores, better performance and a greater return on your Google Ads investment? Here are my best tips.
1. Get to know Quality Score and give it the attention it deserves
Hopefully by now, you’re convinced that:
- Quality Score is a key Google Ads metric that governs CPC, Ad Position, and thus pretty much all the other important metrics, including cost per conversion.
- Quality Score is calculated primarily based on the CTR of your keywords/ads relative to the expected CTR for your current ad position.
- Google expects rather high CTRs of your ads!
Sounds like CTR is pretty important, doesn’t it? Look at your Quality Scores through a CTR lens and focus on getting your CPC/CPA down and your positioning up through better CTRs.
2. Focus on commercial intent keywords for raising CTRs
CTRs on PPC ads vary wildly from 0.1% to +70%. What is the discriminating factor?
Commercial intent. People are far more willing to click on ads if they’re looking to buy things.
High commercial intent keywords, such as branded keywords or actual products and services (e.g. Nikon d800, stainless steel dishwasher, PPC management software, etc.) have much higher CTRs than informational keyword searches (who won the battle of 1812, how do you wash dishes, how to take good pictures, etc.), where people are far less likely to click on ads due to the informational nature of the query. They’re in the very early stages of their buying journey (if they’re even going to become a buyer) and aren’t yet interested in being sold to.
Also, bid on your own branded terms! This will help raise your accounts’ average Quality Score.
3. Look for Google Ads jackpots
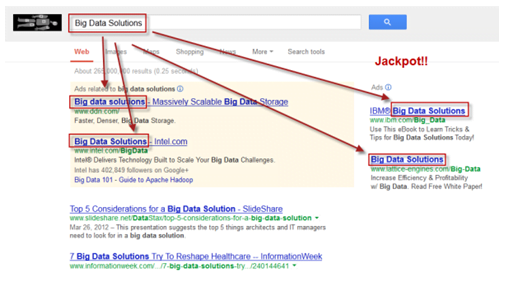
Another great way to raise CTRs is to look for Google Ads Jackpots (my own terminology), which is what I call it when all of the paid search ads for a search query are the same or are pretty similar, like this:
I call this “hitting the Google Ads Jackpot” because it’s just like hitting a row of lucky 7’s when playing the slots in Vegas – because there are valuable optimization opportunities to be had here!
These jackpots generally arise due to a complete lack of marketing creativity on the part of the SEM manager, or excessive usage of Dynamic Keyword Insertion. Google Ads Jackpots represent a great opportunity for an SEM manager to do some good old-fashioned marketing and optimize ad text in such a way to differentiate one’s products or service offerings among a crowded pool of similar ad listings. Start by asking yourself questions like this:
- What is the offer? Is it something they really want?
- What do your customers fear the most? What do they love the most? Who do they trust? Who is the enemy?
- What is your unique selling proposition? How are you different/better than all the others?
- What is your guarantee?
Then you’ll stand out and get all the clicks.
4. Get serious about your ad spend
At the risk of generalizing here, where people generally get tripped up in Google Ads is that they greatly underestimate the expected CTR Google has for their ads; in other words, your 1% CTR keyword isn’t as good as you think it is. PPC marketers can also be incredibly lazy and write pretty dumb ads.
Recently, I looked into the account history logs of a few hundred accounts and found that there’s not a heck of a lot of stuff happening in the typical Google Ads account.
It is only through diligent and ongoing optimization—adding negative keywords, trying out different ads, etc.—that you can improve your CTRs. Only 1% of small business advertisers made weekly changes within their Google Ads account in the last quarter. That is a massive opportunity for 99% of advertisers to roll up their sleeves and get busy outbidding, out-writing, out-testing and outperforming their competitors. The good news is that the bar is very low and spending just 20 minutes every week on PPC over a quarter would put you in the top 1% of most active advertisers!
5. Truly integrate your efforts across SEO, content & PPC
Google so greatly rewards high CTR/Quality Score ads (and conversely penalizes keywords with lousy CTRs) that an awesome hybrid solution becomes apparent: use your content marketing efforts to cover informational keywords with SEO content and commercial keywords via PPC.
This strategy also makes sense in that it’s getting harder to rank on commercial keywords for organic terms, as massive, blinged-out Product Listing Ads typically take >85% of the above the fold browser space. Plus, that information-rich content is a perfect match for informational queries. This strategy of using both PPC and SEO for different query types is what I do for my own PPC.
In summary…
Google Ads, like other marketing channels out there, isn’t just a brainless coin-operated system as many believe it to be. Your ability to pick keywords and write great ads has a tremendous impact on the ROI of your campaigns. Google Ads is hackable and you are in control of your PPC destiny.
I hope a deeper understanding of the inner workings of Quality Score and just how deeply CTRs affect your Google Ads performance is the catalyst you need to start making substantial changes in how you do paid search.
Which of the tips above do you think will be the easiest—or the most complicated—to put into action? Are you reaping the rewards of high Quality Scores or suffering penalties due to low Quality Scores? Share your thoughts below!
Hit me up on Twitter:
Find out how you’re REALLY doing in Google Ads
Use our Free Google Ads Grader to get a full audit of your account and an easy-to-read and actionable report.

