Whatever you pay attention to tends to grow. That’s certainly true for online advertising. When you tend to the results of your various campaigns, you see what’s not working and what’s worth doubling down on.
Of all the metrics you can view, conversion rate and cost per lead are two of the most compelling. When they’re up, it’s a clear signal that everything from targeting to copy is in alignment.
A great step in setting goals and monitoring your conversion results is defining what those results should look like. What’s a high Google Ads conversion rate? What’s a good Meta Ads cost per lead? And how does conversion rate optimization change depending on your industry?
These are the questions we’re here to answer. With this guide, our goal is to provide the essential conversion rate benchmarks you need to get your conversion rate optimization (CRO) efforts off to the right start.
Contents
- Average Google Ads conversion rates by industry
- Average Google Ads cost per lead by industry
- Average Facebook Ads conversion rates by industry
- Average Facebook Ads cost per lead by industry
- Average display and video ads cost per lead by industry
Conversion rate benchmarks for Google Ads
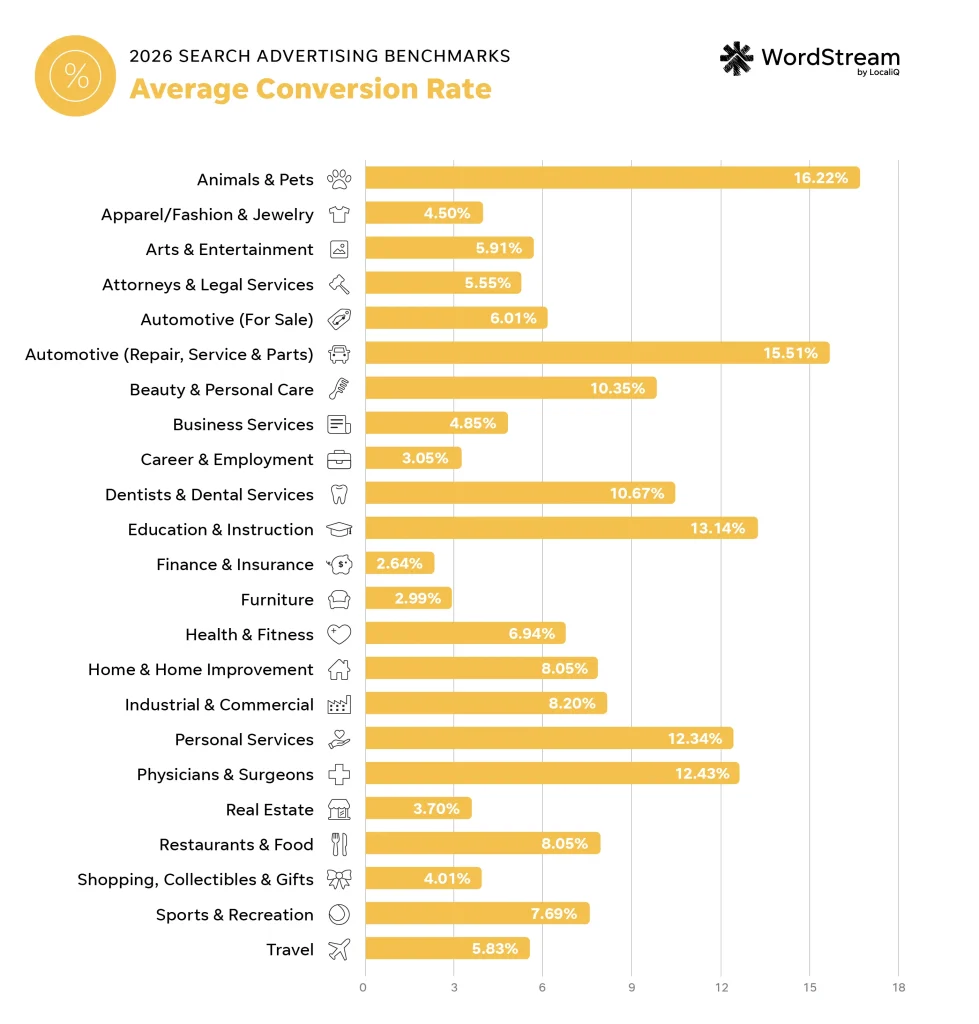
The average conversion rate across Google Ads is 8.18%.
✴️ Note: We update this data regularly! Download the PDF of our latest Google Ads Benchmarks report here.
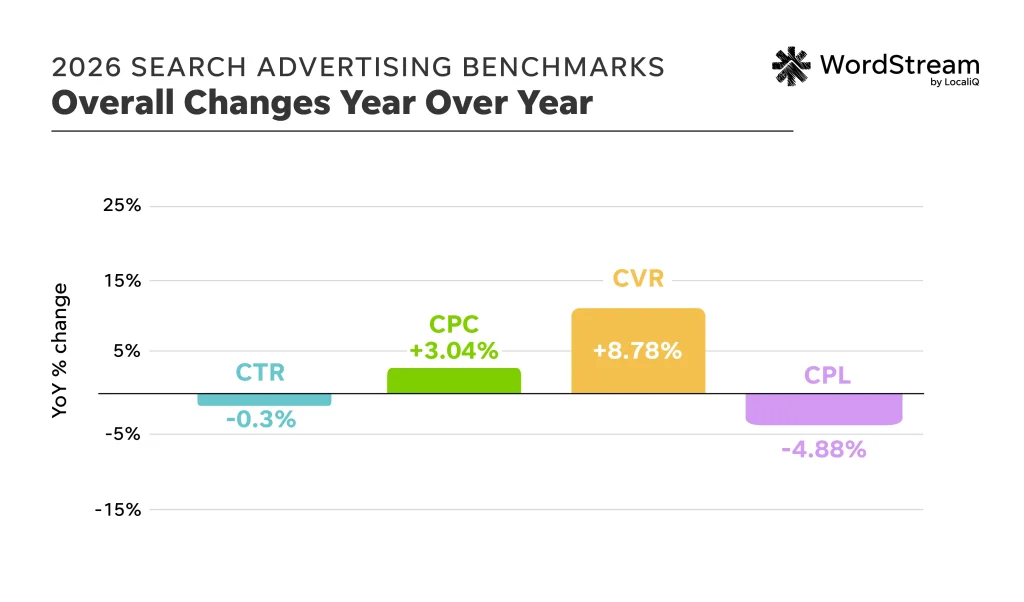
Conversion rates in Google Ads keep moving in the right direction. In our 2025 benchmarks, the average conversion rate was 7.52%. This year, it’s 8.18%. That’s an 8.8% year-over-year increase, and the second year in a row that average CVR has gone up.
Google Ads conversion rates tend to vary from vertical to vertical, so here is a more granular breakdown of Google Ads CVR by industry:
| Business category | Average CVR |
| Animals & Pets | 16.22% |
| Apparel / Fashion & Jewelry | 4.50% |
| Arts & Entertainment | 5.91% |
| Attorneys & Legal Services | 5.55% |
| Automotive — For Sale | 6.01% |
| Automotive — Repair, Service & Parts | 15.51% |
| Beauty & Personal Care | 10.35% |
| Business Services | 4.85% |
| Career & Employment | 3.05% |
| Dentists & Dental Services | 10.67% |
| Education & Instruction | 13.14% |
| Finance & Insurance | 2.64% |
| Furniture | 2.99% |
| Health & Fitness | 6.94% |
| Home & Home Improvement | 8.05% |
| Industrial & Commercial | 8.20% |
| Personal Services | 12.34% |
| Physicians & Surgeons | 12.43% |
| Real Estate | 3.70% |
| Restaurants & Food | 8.05% |
| Shopping, Collectibles & Gifts | 4.01% |
| Sports & Recreation | 7.69% |
| Travel | 5.83% |
⚡ Are there opportunities to optimize your Google Ads for higher conversions? Find out instantly with the Free Google Ads Grader.
How much does a Google Ads conversion cost?
The average cost per lead across Google Ads is $66.69.
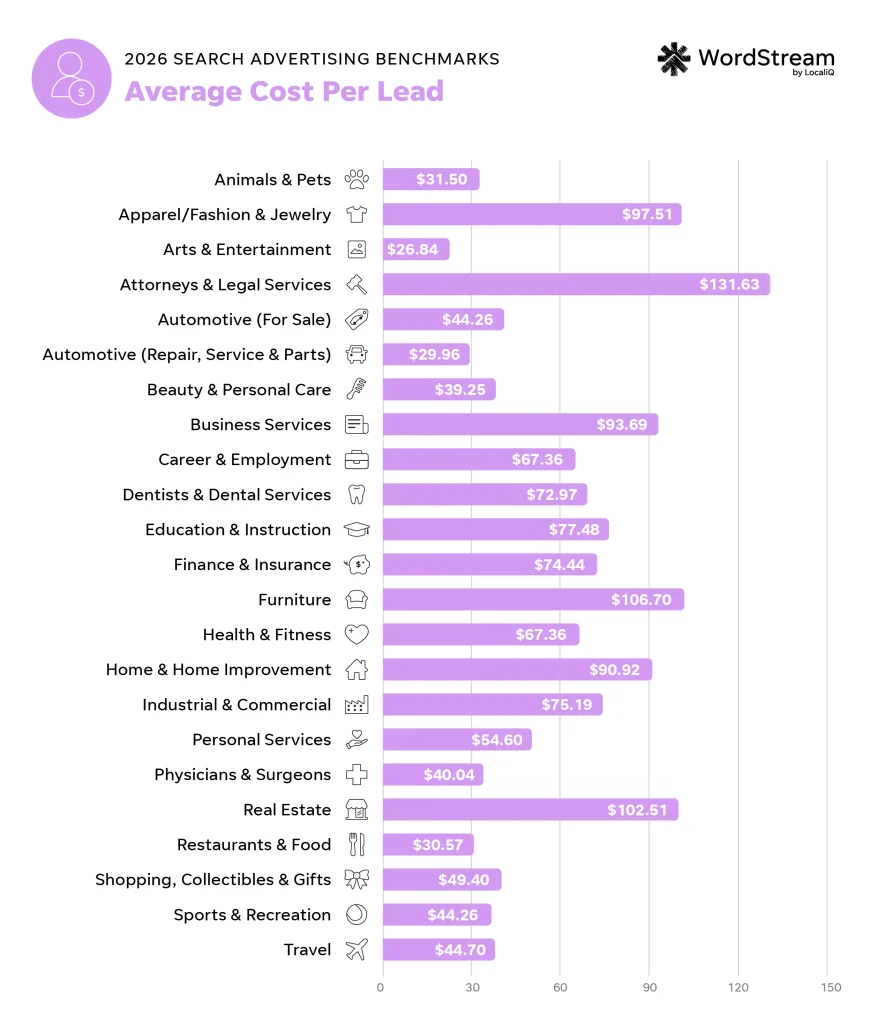
Taking a look at the industries with the highest average costs per lead (Attorneys & Legal Services at $131.63, Furniture at $106.70, and Real Estate at $102.51), we see a common theme: high-ticket purchases. Legal fees, a new dining set, and a home all come with big price tags, and people don’t commit to them on a whim.
At the other end of the spectrum, the industries with the lowest costs per lead are Arts & Entertainment ($26.84), Automotive Repair, Service, & Parts ($29.96), and Restaurants & Food ($30.57). What they share is timing. People searching in these industries usually need an answer now. You don’t spend weeks picking a restaurant for tonight or a show for this weekend, and when your car breaks down, you want it fixed as fast as possible. Shorter decisions mean fewer clicks before someone takes action, which keeps each lead cost down.
| Business category | Average CPL |
| Animals & Pets | $31.50 |
| Apparel / Fashion & Jewelry | $97.51 |
| Arts & Entertainment | $26.84 |
| Attorneys & Legal Services | $131.63 |
| Automotive — For Sale | $44.26 |
| Automotive — Repair, Service & Parts | $29.96 |
| Beauty & Personal Care | $39.25 |
| Business Services | $93.69 |
| Career & Employment | $67.36 |
| Dentists & Dental Services | $72.97 |
| Education & Instruction | $77.48 |
| Finance & Insurance | $74.44 |
| Furniture | $106.70 |
| Health & Fitness | $67.36 |
| Home & Home Improvement | $90.92 |
| Industrial & Commercial | $75.19 |
| Personal Services | $54.60 |
| Physicians & Surgeons | $40.04 |
| Real Estate | $102.51 |
| Restaurants & Food | $30.57 |
| Shopping, Collectibles & Gifts | $49.40 |
| Sports & Recreation | $44.26 |
| Travel | $44.70 |
Conversion rate benchmarks for Facebook Ads
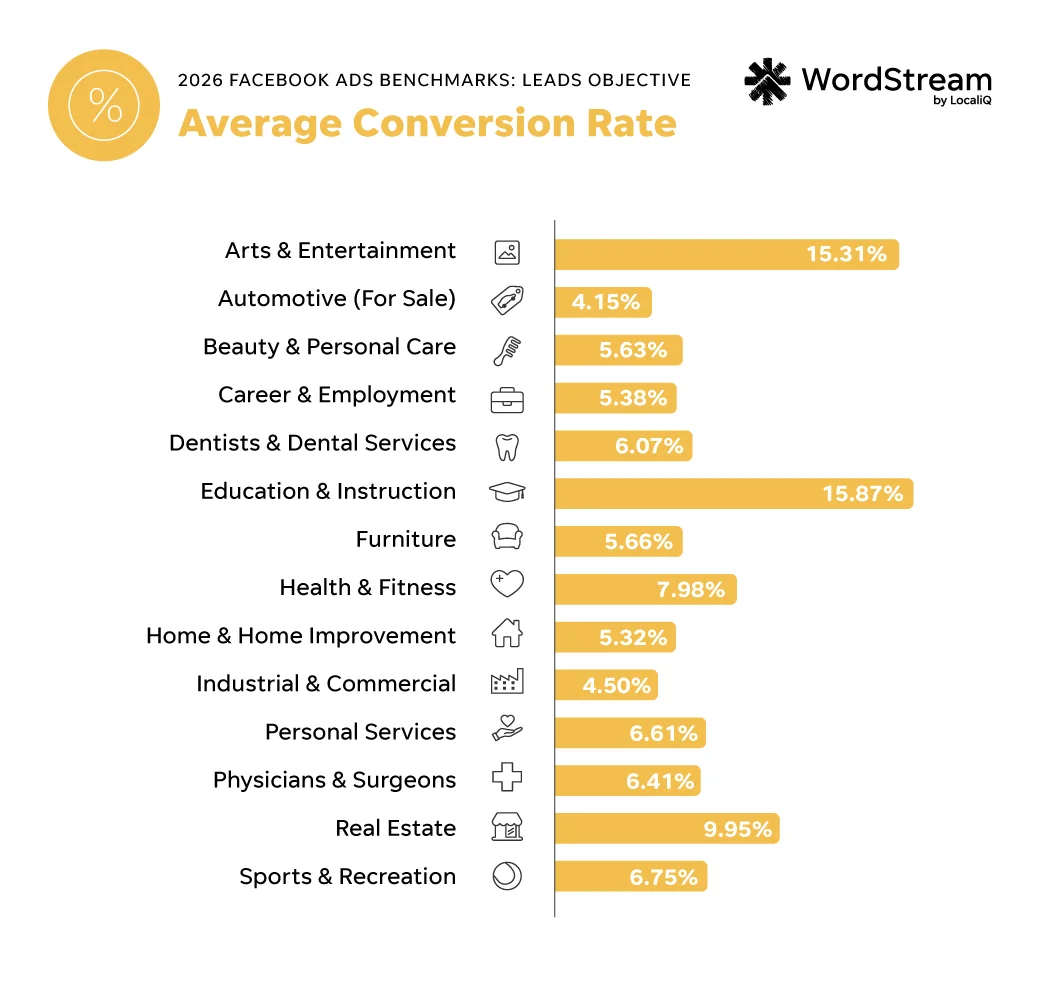
The average conversion rate across Facebook Ad leads campaigns is 8.54%.
Facebook is one of the most cost-effective places to find new leads, especially for local businesses. People aren’t searching for you on Facebook, which is actually an advantage. Your ad reaches them before they’ve started comparing options, so you own early discovery. And with Facebook lead ads, the form automatically fills in their contact info. Saying “yes” takes a couple of taps.
Education & Instruction (15.87%) and Arts & Entertainment (15.31%) top the conversion rate list. Both convert at nearly double the overall average. That’s roughly one lead for every six or seven clicks. Real Estate rounds out the top three at 9.95%. What these industries share is that they’re fun to browse. People scroll class schedules, event lineups, and home listings in their downtime anyway, so a Facebook ad doesn’t really feel like a disruption.
On the other end, Automotive For Sale (4.15%), Industrial & Commercial (4.50%), and Home & Home Improvement (5.32%) convert at about half the average rate. These are big, need-driven purchases, so fewer people click here. If you’re in one of these industries, Facebook still has a job to do. Use it to stay top of mind. Try making your first ask smaller, like a free estimate or a buying guide, to get more early shoppers in your lead pipeline.
| Business category | Average conversion rate |
| Arts & Entertainment | 15.31% |
| Automotive — For Sale | 4.15% |
| Beauty & Personal Care | 5.63% |
| Career & Employment | 5.38% |
| Dentists & Dental Services | 6.07% |
| Education & Instruction | 15.87% |
| Furniture | 5.66% |
| Health & Fitness | 7.98% |
| Home & Home Improvement | 5.32% |
| Industrial & Commercial | 4.50% |
| Personal Services | 6.61% |
| Physicians & Surgeons | 6.41% |
| Real Estate | 9.95% |
| Sports & Recreation | 6.75% |
How much does a Facebook Ads conversion cost?
The average cost per lead across Facebook Ads is $27.39.
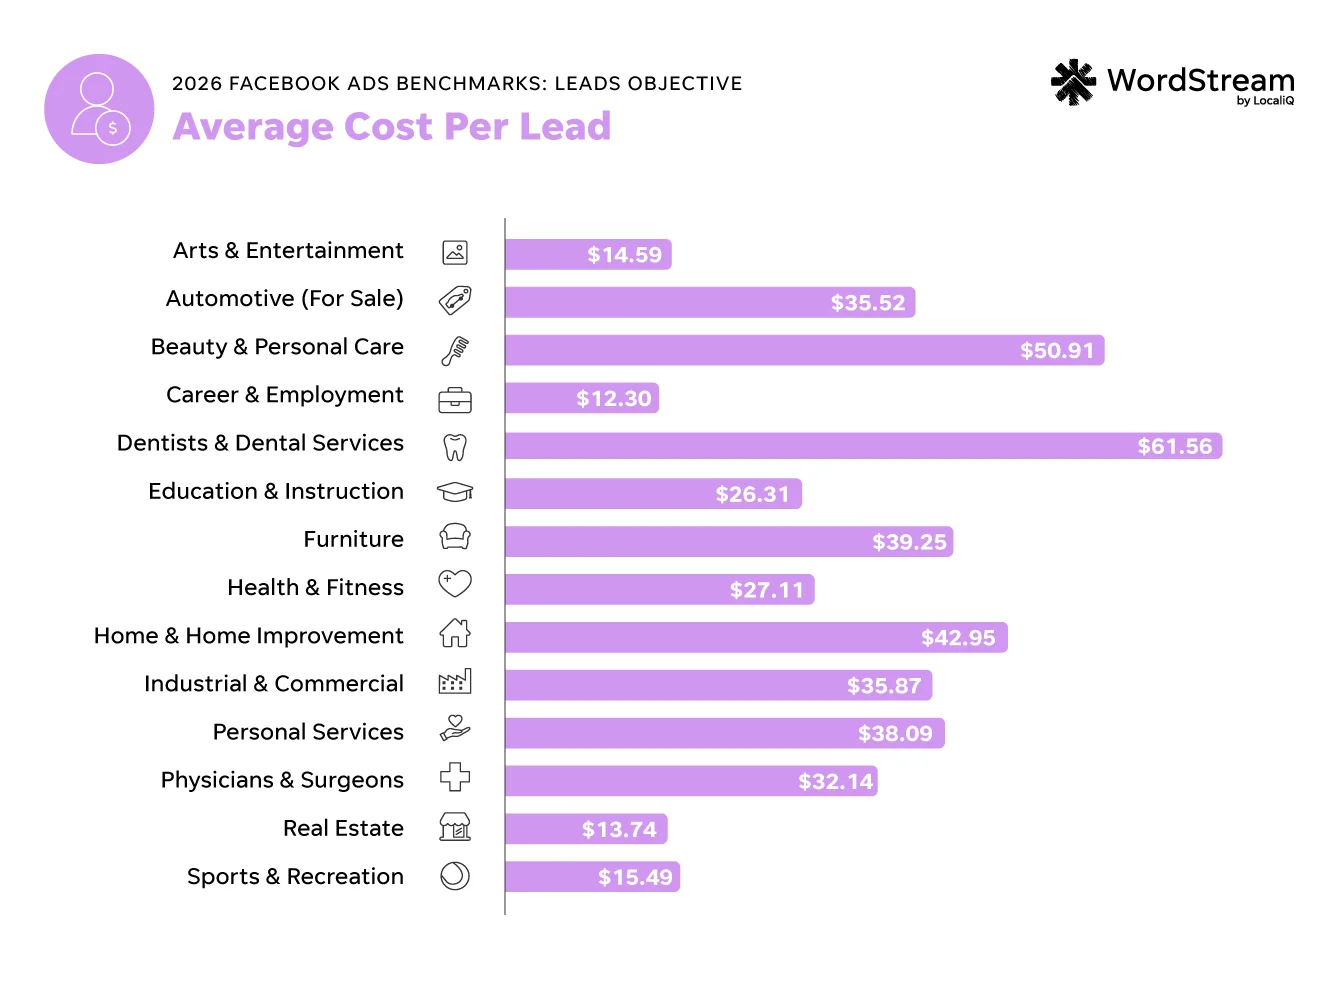
Here’s some good news for your budget. In 13 of the 14 industries we track for Facebook leads campaigns, the average cost per lead is lower on Facebook than on Google Ads. Sometimes the gap is dramatic. The average Real Estate advertiser pays $102.51 per lead on Google, but just $13.74 on Facebook. That’s about one-seventh the cost.
Search leads often come with stronger buying intent, so a Google lead may be worth more to you than one from your Facebook ads. Still, if you’re in Career & Employment ($12.30), Real Estate ($13.74), or Arts & Entertainment ($14.59), the three industries with the lowest Facebook CPLs, Facebook is an affordable way to reach people who are interested before they jump into a search engine.
At the other end, Dentists & Dental Services ($61.56), Beauty & Personal Care ($50.91), and Home & Home Improvement ($42.95) pay the most per Facebook lead. Dental and home services buyers aren’t usually just window shopping (unless you sell windows). When they crack a tooth or spring a roof leak, they’re more likely to act when they see an ad, so competition is higher.
| Business category | Average CPL |
| Arts & Entertainment | $14.59 |
| Automotive — For Sale | $35.52 |
| Beauty & Personal Care | $50.91 |
| Career & Employment | $12.30 |
| Dentists & Dental Services | $61.56 |
| Education & Instruction | $26.31 |
| Furniture | $39.25 |
| Health & Fitness | $27.11 |
| Home & Home Improvement | $42.95 |
| Industrial & Commercial | $35.87 |
| Personal Services | $38.09 |
| Physicians & Surgeons | $32.14 |
| Real Estate | $13.74 |
| Sports & Recreation | $15.49 |
How much do display and video ads cost?
The average cost per lead for a display and video ad is $114.44.
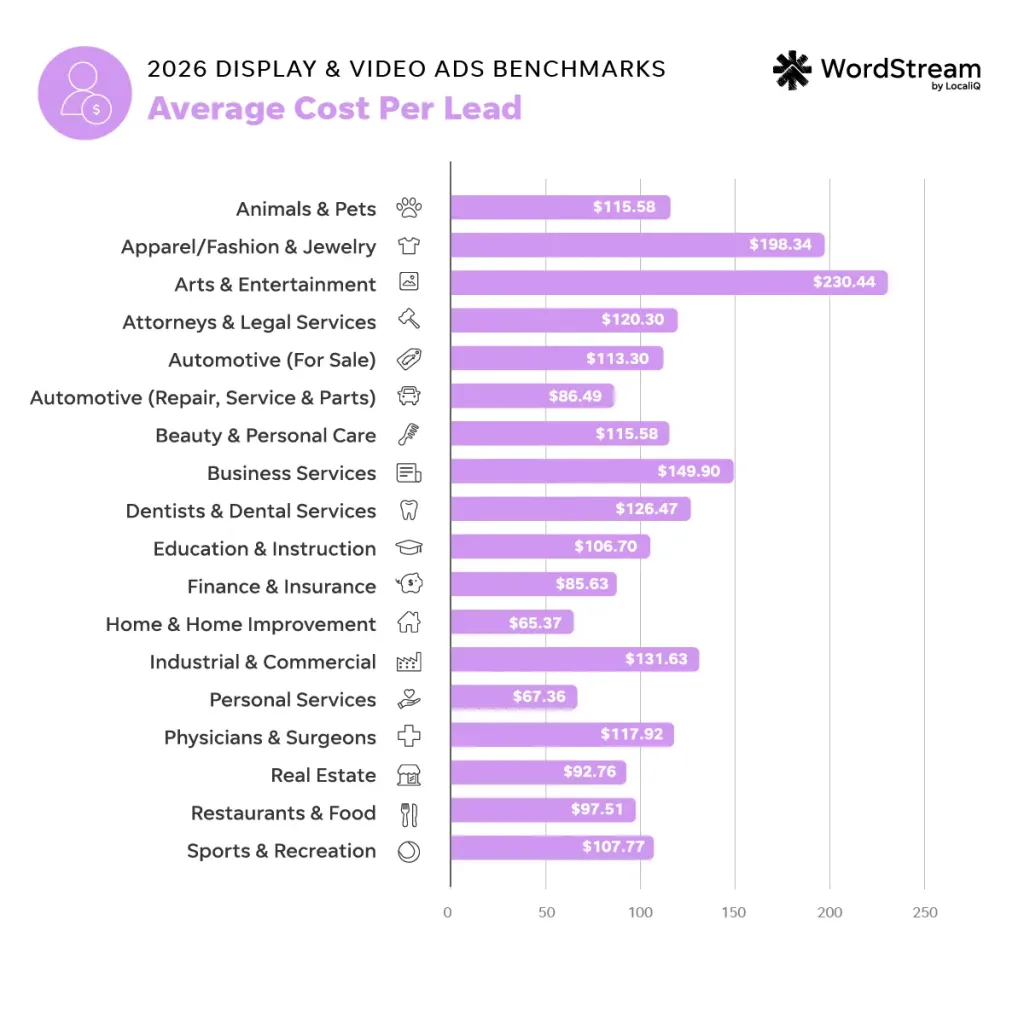 Display and video ads run across hundreds of websites, apps, and networks, reaching people while they read the news, watch videos, or scroll. Their main job is to put your business in front of people before they’re ready to buy, a strategy called pre-marketing. That’s why cost per lead runs higher here than on search or social. Still, display campaigns do drive leads, so CPL is worth checking in on regularly.
Home & Home Improvement has the lowest display CPL at $65.37, followed by Personal Services ($67.36), and Finance & Insurance ($85.63). Home projects are usually planned weeks or months out, so a display ad for a kitchen remodel or a new roof can reach someone at the beginning of their research, long before they hire a professional.
At the high end, Arts & Entertainment ($230.44), Apparel/Fasion & Jewelry ($198.34), and Business Services ($149.90) pay the most per display lead. For the first two, that number tells only part of the story. People buy concert tickets and clothing through a checkout page, not a lead form, so many valuable sales won’t show up as leads. If you’re in one of these industries, judge your display ads by sales and site visits as well as CPL.
| Business category | Average CPL |
| Animals & Pets | $115.58 |
| Apparel / Fashion & Jewelry | $198.34 |
| Arts & Entertainment | $230.44 |
| Attorneys & Legal Services | $120.30 |
| Automotive — For Sale | $113.30 |
| Automotive — Repair, Service & Parts | $86.49 |
| Beauty & Personal Care | $115.58 |
| Business Services | $149.90 |
| Dentists & Dental Services | $126.47 |
| Education & Instruction | $106.70 |
| Finance & Insurance | $85.63 |
| Home & Home Improvement | $65.37 |
| Industrial & Commercial | $131.63 |
| Personal Services | $67.36 |
| Physicians & Surgeons | $117.92 |
| Real Estate | $92.76 |
| Restaurants & Food | $97.51 |
| Sports & Recreation | $107.77 |
Use industry conversion rate benchmarks to grow!
These conversion rate and cost per conversion benchmarks help contextualize your own results. While every business is unique, seeing where your industry lands can help you strategize future campaigns.
Use these insights to drive better results on your advertising spend. For more ways to make the most of this data and maximize your CVRs across platforms, reach out and we’ll show you how our solutions can help!
About the WordStream Blog
We've been a trusted source of data, news, and strategy for over 15 years. All of our content is written and reviewed by real people: a dedicated team of professionals with decades of combined experience in marketing and advertising for businesses of all sizes.


Add us as a preferred source on Google


Meet The Author
Rob Glover
Rob is the Senior Copywriter at WordStream and LocaliQ, with over 10 years of experience in paid and organic marketing—including SEO, social media, content marketing, and local search. He’s worked across dozens of industries, from SMBs to enterprise, and now specializes in helping businesses build sustainable growth strategies. His work has appeared in Search Engine Land, eMarketer, and more. Outside of marketing, he loves to travel, camp, and mountain bike with his wife and dog.
Recommended for you


![Search Advertising Benchmarks for Your Industry [Report]](https://www.wordstream.com/wp-content/uploads/2024/04/RecRead-Guide-Google-Benchmarks.webp)